
.jpg)
The reason Chancellor George Osborne gave for increasing the stamp duty to second home owners – especially hitting out at profits made by buy-to-let investors – was to prevent a ‘bubble’ forming. His fear, backed up by Mark Carney, governor of the Bank of England, was that buy-to-let investors would buy too much property, apparently at a high price, driving up prices more during a boom and causing them to fall more during a recession.
Download my comprehensive property price report
To some extent they are right and this happened during the last property price recession with investors overpaying for many city centre flats which are now selling for half the price paid and probably won’t regain their value for another generation.
However, the latest property price news shows that the introduction of the 3% stamp duty has actually, in the short term at least, caused the very bubble the government and Bank of England have just tried to avoid! Genius!
Read - First Time Buyer Quick Guide
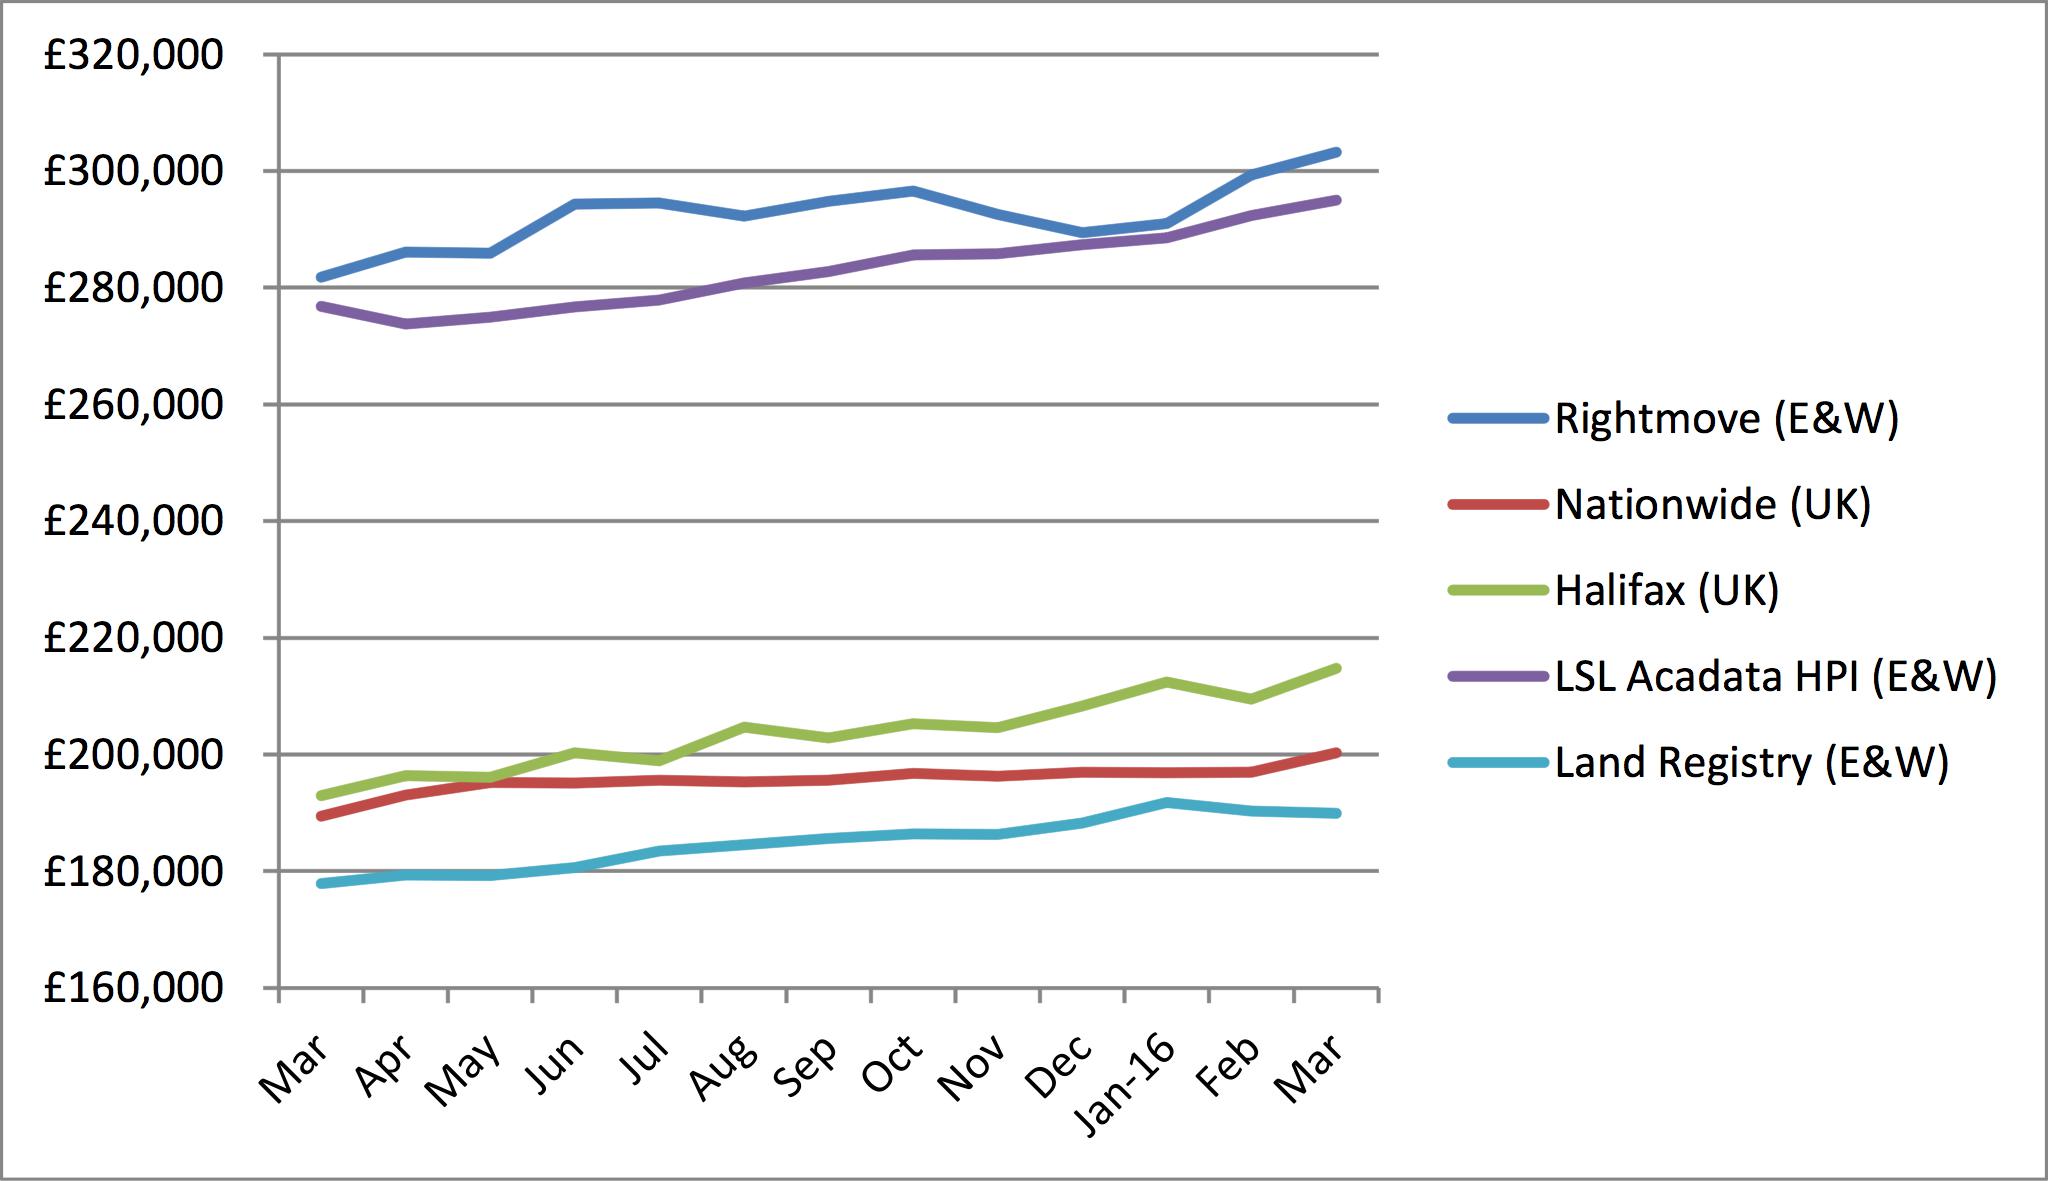
Latest headlines from my comprehensive, straightforward property price report for May 2016
The key takeaways from reading every property price report are:
Property price inflation jumped during March, with increases of 5-9% year on year;
“There were 165,400 transactions in March, an all-time high, some c.11% higher than the previous peak of c.149,000 recorded in January 2007.” – Nationwide;
“The distortion caused by this stamp duty change appears to be larger than any previous stamp duty change we’ve seen.” – CML.
The issues caused in March – and of course lots of chats about the doom and gloom surrounding Brexit – have led to confidence in the UK housing market being “at its lowest level in over a year,” according to Halifax, so although high now, price growth may recede over the summer
Crikey, without political intervention, it’s likely that the property market would have just rumbled along this year. Instead, even though we aren’t even halfway through the year, we’ve ended up with a mini boom and, as confidence is a key driver of this market, are probably heading for a bit of a mini stagnation, all thanks to politics!
Read - Trading Up Property Checklist
Latest statistics show UK rises are around 5% YoY for mortgaged sales, up to 9% when including new build and cash sales (now accounting for around 30% of purchases)
Regional changes are vast across the UK
It really is time that anyone moving or investing in property pretty much ignored average prices. Our report is useful to gain an understanding of what’s happening in the market – and trends to look out for. But at the end of the day, the averages distort what’s happening to three-bed semis in West Bridgford in Nottingham versus flats in the Jewellery Quarter in Birmingham, so to individuals carrying out property projects, you just need to know whether your property purchase/sale is reacting differently to the ‘norm’ and why.
Download my comprehensive property price report
Here’s a great chart from the LSL Acadata HPI that shows how the south is performing versus the rest of the country; we certainly are not seeing a ‘bounce’ back from the recessionary falls of 25-50% in the Midlands/Wales and North that the South is experiencing:
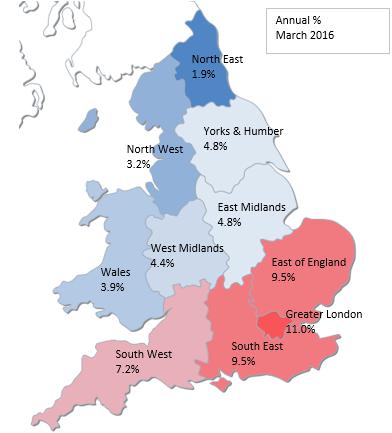
LSL Acadata HPI - Heat Map of the annual change in the average house price, analysed by region, March 2016
What’s happening in your local town?
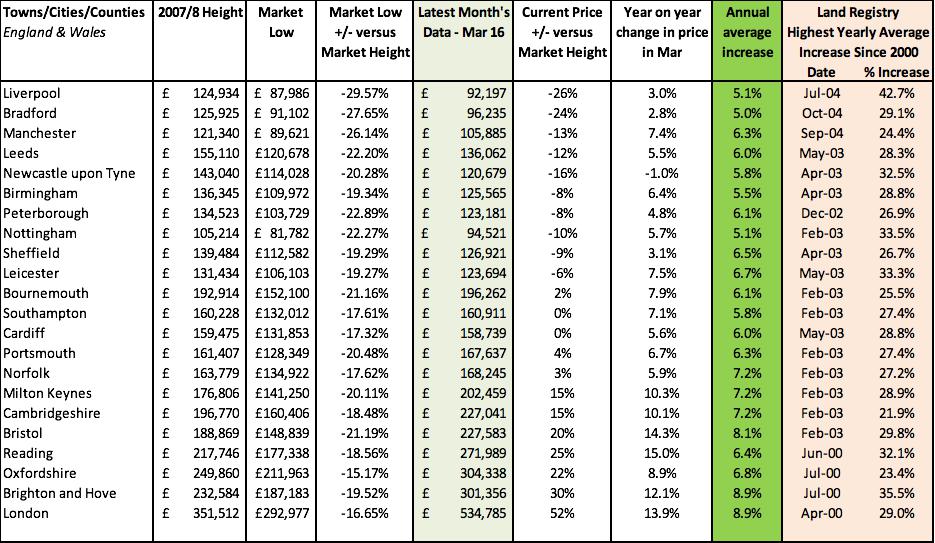
The variation of property price performance across England and Wales is vast. My analysis of 22 towns shows that:
The best performing town is Bristol:
Up 14.3% YOY
Prices 21% below market height
Annual average increase of 21%
The worst performing town is Liverpool:
Up 3% YoY
Prices 26% below market height
Annual average increase of 5.1%
Interestingly, London does best on performance since the market height, but rates of growth are slowing...
Read - Financing a Buy to Let
Don’t forget – if you are buying or selling, it’s essential to take a look at sold property prices and if you use Nethouseprices.com then you’ll be able to see who sold the properties similar to the ones you want to buy and this will help narrow down your search of who to talk to first.
