Are South East prices growing or slowing?
Report headlines
Nationwide “Overall, prices in Southern England (South West, Outer South East, Outer Metropolitan, London and East Anglia) were up 5.5% year-on-year.”
LSL Acadata HPI “The annual rate of house price inflation for the South East region is 4.9%.”
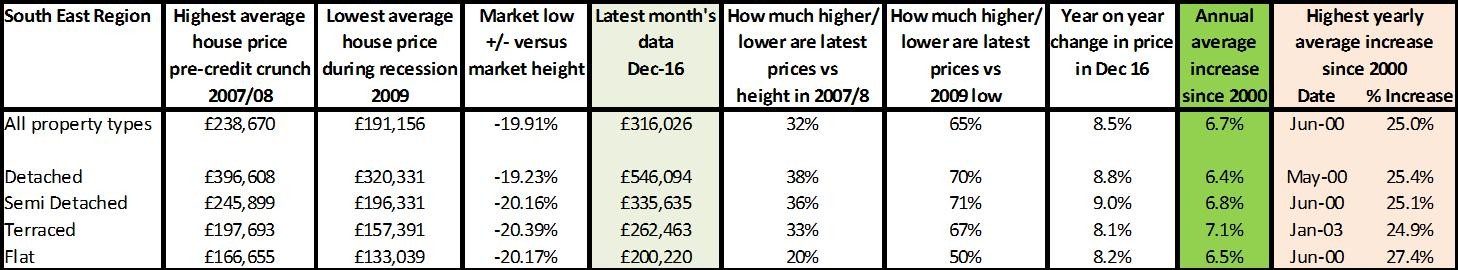
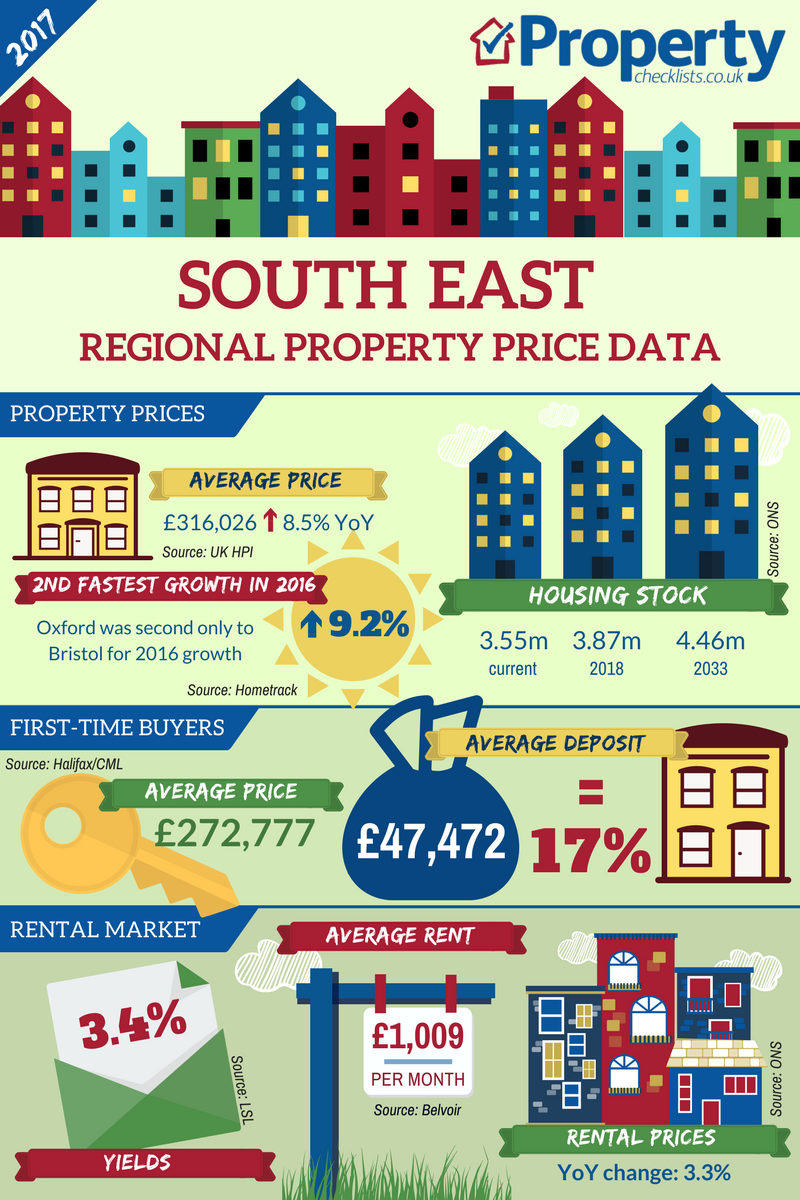
Source: UK HPI
We often refer to the South East as ‘unaffordable’ and I think many would believe that property prices in the area are guaranteed to go one way: and that’s up. Looking at the data above, it looks pretty healthy, unless you start digging a little deeper.
Growth of 20-38% since the pre-credit crunch heights do look good until you compare them to the annual average growth rates seen since 2000 and indeed the one-off growth rates seen in 2000 and in 2003, which pretty much saw this level of growth in just one year.
The reality is that for a property to be worth £316,000 today – up from £238,000 in 2007/8 – this suggests an average growth of just 3% each year, half that of annual growth rates since 2000. From an investment perspective, this means those who have invested in cash have a property which has only just kept ahead of inflation. What these numbers suggest is that, yes, property prices are moving forward, but at nowhere near the pace they have historically. Good news for those wanting to get on the ladder, not such good news for investors who have bought and owned property with cash.
What is also interesting is the poor performance of flats compared to houses. Basically, what the stats suggest is that flat values grow at half that of detached homes and, with increased costs of service charges and ground rents, investors in particular should be double checking their returns compared with houses. And those looking at getting on the ladder should note that, while prices of flats are initially ‘better value’, they potentially grow at a lower rate, making it harder to make the move from flat to house in the future.
Towns and cities
LSL Acadata HPI “Top performing regions included the South East, increasing 4.9% annually with double digit growth in Medway and Portsmouth.” (Jan 17)
Hometrack “Cambridge and Oxford have recorded strong price gains of >75% which have resulted in record high price to earnings ratios in these cities.” (Jan 17)
Source: UK HPI
As with any region, some areas perform better than others. Heavyweight economies such as Oxford and Cambridge are delivering growth previously reserved for London as their universities power local and international business investment. In Oxford the planning ‘noose’ around the neck of the area means building any housing within its bypass area is virtually impossible, meaning investment going into nearby areas such as Bicester. Meanwhile, heading south to Portsmouth and Southampton, since the credit crunch both areas have struggled to maintain previous growth rates, with current property prices – nearly 10 years on – just 15-18% higher than before the crash. This is significant as a property bought for cash in Portsmouth for £170,000 needs to be worth in excess of £216,000 to have kept its value versus inflation, let alone the buying/selling costs involved. Yet according to these numbers, the average is just £195,000, meaning cash owners/investors have actually lost at least £20,000 in real terms – and more when it comes to cashing in the investment/ownership. It does mean, though, that both of these areas could be good potential places for those who want to stay in the South East but are struggling to get a foot on the ladder. It’s worth checking out, especially with a possible daily commute of just over an hour from Southampton, and a possible place to live and work while still being in hailing distance of the capital.
Looking for your first home? Read our FTB quick guide.
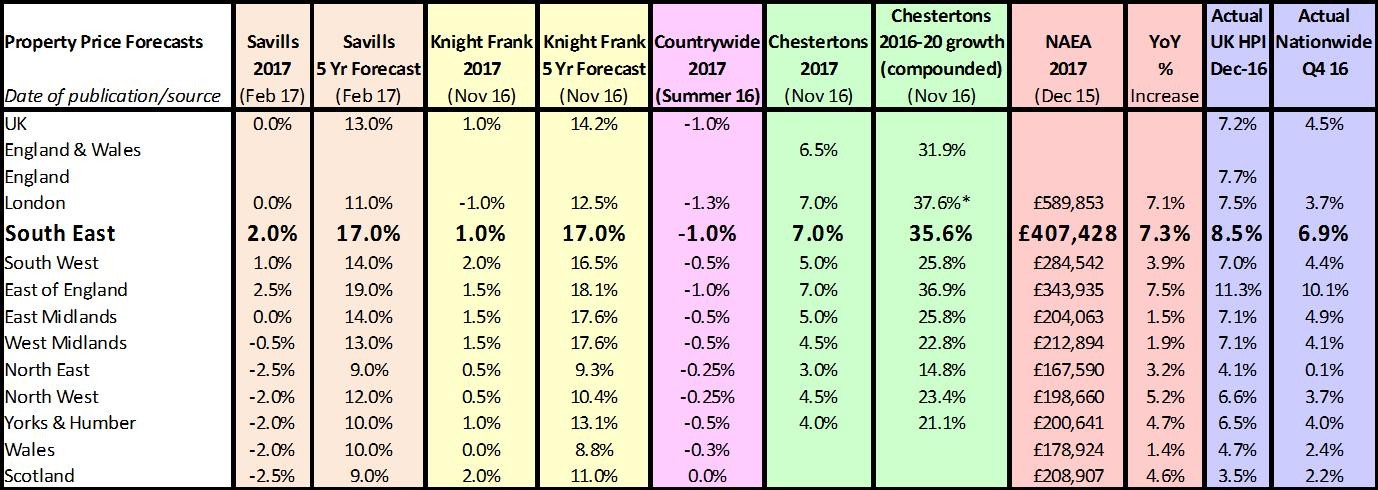
With 2016 vs 2015 property price YoY growth 8.5%, from a buying perspective it may feel that prices are rising rapidly, but put in context this means prices, on average, are just 3% higher each year since the credit crunch. Moving forward, this growth is forecast to slow, too, with the likes of Savills, Knight Frank and Countrywide all predicting even lower rates of growth while Chestertons and NAEA suggest increases of 7% year on year will remain. From a forecast perspective, it appears that getting on the ladder sooner rather than later would be an advantage, but make sure you can afford it, whatever life throws at you (job loss, relationship breakdown etc) so you don’t get stuck with a property you can’t afford and are forced to sell. A good way to help plan for this is to check out how well your property would let for if you needed to move out and it wasn’t a good time to cash in.
Supply and demand
Surprisingly, only Wokingham saw higher transactions than the previous year, suggesting that most people are buying a main home here as opposed to a second home. The rush to purchase properties back in the first quarter of 2016 sucked many a purchase from the rest of the year and is clearly heavily impacting on purchases since this time, leading to overall transactions being anything from 9% down in the Isle of Wight to 24% down in Oxford.
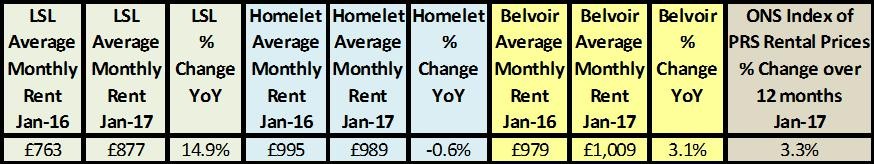
LSL “The South East saw strong rent rises across the year (4.6%).” (Jan 17)
For more rent stats visit our comprehensive data page.
Looking to rent? Read our how to rent quick guide.
Despite price growth in the South East, rents have, in the main according to Belvoir and the ONS data kept relatively in line with inflation and indeed with wage growth. Despite the fact that landlords and agents are often accused of charging ‘sky rocket rents’ or raising rents. In fact, even in the White Paper, rents were (wrongly) referred to as ‘expensive’ by the government; the reality is that up until now, rents have kept up in line wage growth. Sadly, government intervention is likely to break this ‘perfect market’ by raising the costs of delivering legally and safely let properties through higher health and safety requirements coupled with somewhat unnecessary loss of tax relief which is about to start to cause landlords (and agents) an absolute tax administration nightmare!
For more, download our in-depth analysis of property in the South East.
