
The indices are all full of the joys of the current Boris or Brexit bounce as the market kicks starts the year with a cracking set of numbers showing increased activity, which will be much welcomed, especially in London, the South and East.
But, it’s always worth taking a look back at what has happened and not get too carried away with the current enthusiastic commentary.
Looking at the average property price data from the indices back to 2007 – over 13 years – we can see they do give, over time some similar results, but also vary quite substantially. For example, looking at the mortgaged indices (Halifax and Nationwide) prices have risen from 2007, by 23-27% while those that include cash sales have recorded a rise of 35-41% (UK HPI and LSL). As far as the time it took for property prices to recover, this does vary from 2010 according to LSL’s index through to 2014 according to Nationwide and UK HPI.
The most startling figures though come when you look at how much prices have risen according to the indices from 2017 when we started to see a bit of a slowdown from the credit crunch recovery, so over the last three years, we have seen growth of just a few percent.

As the table shows, Nationwide and UK HPI continue to ‘track’ each other quite well with a 4-5% rise over the last three years, while the asking price indices show 2-3% and Halifax, as we’ve seen since the credit crunch bears little relation to any of the other indices at all!
What’s clear from this is that there is definitely evidence of a complete slowdown in annual capital growth that we are used to, both now and in the future.
The good news is that hopefully people will find properties more affordable from a starter home perspective, but there is a downside, and that is it makes it more difficult for people to trade up, potentially causing more stagnation in the market as people can’t rely on their property to deliver enough equity to afford to ‘trade up or down’.
Continuing the theme of property price changes, we can see that since 2007/8, annual property price growth has been seen in England of just 2% - versus previously being 6.2%, while year on year, prices are around the 2%+, a little lower than annual increases seen since 2005.

Source: UK HPI
Meanwhile in our other countries, we are seeing Wales and Scotland just keeping positive, nominal price growth, while Northern Ireland over time, has still seen falls.
Overall though, the current year on year increases are ‘average’ for England and slightly better news for Wales, Scotland and NI.
However, we aren’t seeing any real ‘bounce’ back in these countries (on average) which England has experienced. Good for affordability, not good for trading up and down.
Regionally, you can see from the table below that during the credit crunch, when prices fell from 2007 through to 2009 (and later in some regions) prices moved downwards, pretty much by the same amount, 17.57% (Yorkshire) through to 20% in the South East. And the year on year increases over time range from 5.2% (North East) to 6.8% (London) since 2000, falling to 1.1% (North East) through to 5% (London), with even lower rises in most regions since 2007 and for the North East, continued falls.
Currently, prices are still rising, but not by much – a few percent each year, with Yorkshire and Humber showing the best growth of 3.9%.
However, what’s stark is the differential between price rises since the credit crunch, where Londoners have enjoyed (on average) rises over the last 13 years of 62%, the North East still showing a -6% fall during the same period of time.
Bearing in mind during this time inflation has grown by just under 40%, the only regions growing in line with the cost of living are the East and London, not even the South East exceeds this growth, so in real terms house prices in most regions have fallen.
Overall, much as the media are still talking about ‘affordability issues’ and ‘surging’ house prices, this isn’t correct versus historic price growth, and the sooner we are honest with consumers the better. Suggesting prices are still rising significantly gives a false sense of hope and can cause problems for the industry when securing valuations from agents, lenders and surveyors, as a result this ‘disappointment’ can mean less people move.
Although the press concentrate mostly on house prices, what they should really be focusing on is transaction volumes which are critical to the sector and the overall economy.

Source: UK HPI
For the full country and regional analysis, download Kate's comprehensive report here
Continuing the theme of looking at the changes in capital growth from the UK, country and regions, the table below shows that of the major towns across the UK, only six of the cities/towns we track have seen house price growth exceed inflation and at the other end of the scale, five areas don’t even have double digit growth over the last 12 years, showing astonishing differences in property price growth over time.
As with the other area analysis, the data shows that even at town and city level, although Hometrack are saying city growth year on year is looking good, since the credit crunch, London is the only area that’s doing OK over time, despite falls over the last few years, while most other areas are seeing just a few percent in growth on an annual basis.
And the data shows that the ‘ripple effect’ is almost dead since 2005 with the best performing areas since 2005 being Leicester, Milton Keynes, Tunbridge Wells, Oxford, Brighton, Bristol and Cambridge – all spread out across the country, as are the areas that aren’t performing so well, including Glasgow, Newcastle and Belfast.

Source: UK HPI
For a detailed towns and cities' analysis - download Kate's full report here
Property volumes
Transaction wise, LSL’s annual house tracker is a really useful gauge of where we are, with 2019 volumes falling below 2017 and 2018.

Source: LSL Acadata HPI
For this year, property sales are likely to increase in the first half of the year as buyer enquiries rise, although we may have two to three months ‘glitch’ if people’s movements are restricted due to the Coronavirus. This could particularly affect the ‘trading down’ and retirement new build sector who are perhaps the most vulnerable to the virus, but also the most easily ‘spooked’ of the different buying sectors.
My prediction is sales should, go back to 2018 levels, unless the economy is seriously affected by Coronavirus for the long, rather than the short term (see article).
The NAEA show agreed sales are up to eight from seven last year, although strangely, despite all the extra activity, Rightmove report a rise in the time it takes to sell a property, over recent months, although the 71 days is on a par with time taken last January.
Tracking buyer demand
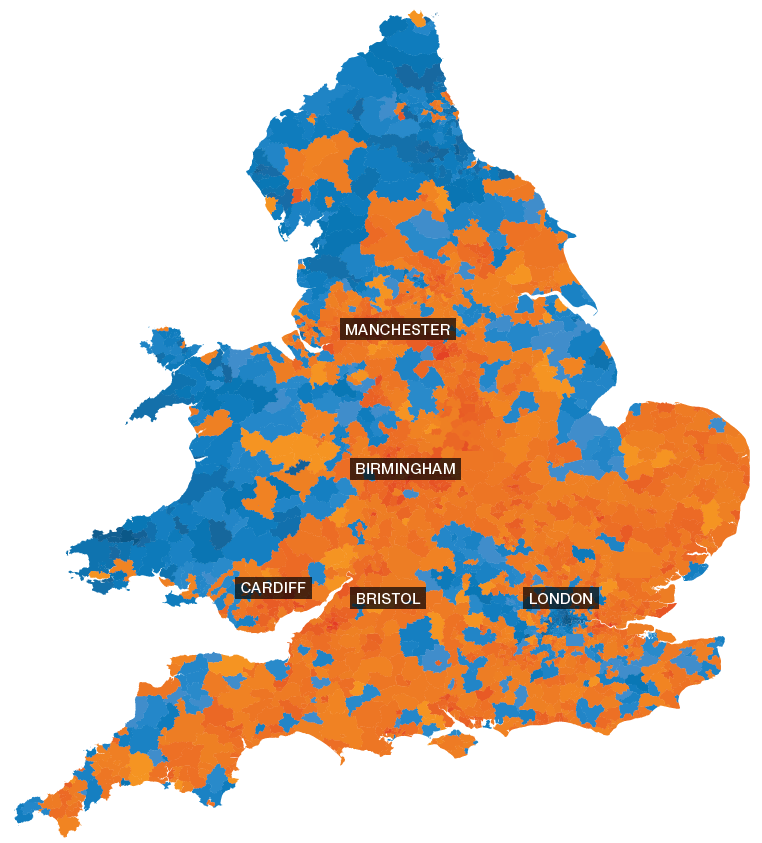
The Advisory track current market conditions so buyers and sellers can gain an independent view of how easy it would be to buy and sell their home in their area. This makes it easier for good agents that are honest about market conditions to value and manage expectations. For example, in M32 74% of the properties on the market are under offer.
From PropCast’s perspective, the hot markets from a postcode perspective don’t necessarily track the overall increases and decreases seen even at town and city levels, with Bristol and Manchester having some of the busiest markets, and London and Liverpool having some of the slower ones.

Source: The Advisory

Source: The Advisory
For the full demand, supply and time on market analysis - download here
|
Are you in a buyer's or seller's The Advisory |
Drain maintenance and pipe Direct Line for Business |
How to get started in property John Howard |
 |
 |
 |
