Normally in the property market, if volumes fall, then price falls will quickly follow. During the credit crunch we saw volumes slip back by 50%, on average, while property prices fell by around 20% - although some areas performed worse and others better.
In some recent market presentations, I was surprised to see how far transactions had fallen back versus previous years and I even spotted that in some areas, based on Land Registry data comparing volumes from January to October 2009 versus 2018, some transactions had fallen back as far as levels experienced in 2009.
I then thought I’d take a look at how volumes had performed for all the towns and cities I track each month to see if there was still a relationship between falls in transactions and property price falls and, if the impact was as severe as the credit crunch.
In theory, this relationship should hold, but the big difference is we don’t have the lack of finance and I wondered how much of a difference this would make.
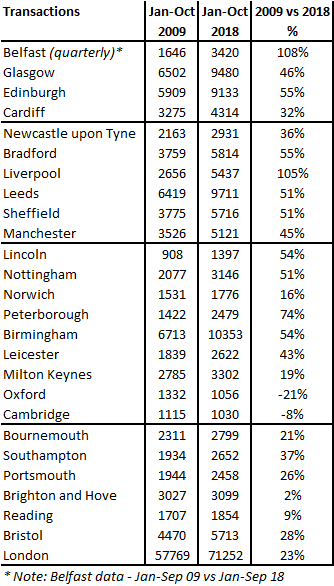
Having looked at the data, Liverpool is currently topping the charts, with transactions 105% higher than they were in 2009, closely followed by Peterborough which has 74% more sales than 2009 and the likes of Edinburgh, Bradford, Birmingham, Lincoln, Nottingham, Sheffield and Leeds all seeing 50-55% growth.
Typically, but not in every case, these areas are also buoyant from an annual property price growth rate, with Liverpool, Edinburgh and Sheffield showing price growth of over 7%, but interestingly it’s not a given, with Bradford and Leeds prices only up by 3.2% and 3.6% respectively, year on year.
The relationship also seems to be different for those areas which have fallen back to 2009 levels – and in some cases even further. For example, Oxford transactions are 21% lower than 2009 and between 2007/8 and 2009, prices had fallen by 23% (see chart below). However, prices aren’t falling at anywhere near the amount they did during the recession, with Oxford prices showing a small increase year on year. And it’s a similar picture for Cambridge, with volumes down 8% versus 2009, while property prices are showing a rise of 1.6%. Brighton and Hove meanwhile has a similar number of sales to 2009, while prices are still up year on year by a healthy 4.4%.
Property sales transactions 2009 vs 2018
Source: Land Registry
So the relationship between transactions falling and property prices following doesn’t seem to be holding – which on one hand is good news in that no-one is ‘panicking’ and that gives the market a chance to recover, albeit the fall in transactions can seriously impact property companies.
Having said this, one of the draw backs of Land Registry data is that it takes a long time to come through. This does leave an opportunity for savvy agents, legal and other local property companies to generate some interesting and more up to date PR than it’s possible to secure from general data.
| Buy to let tax - Nicholsons Chartered Accountants |
Help to Buy a new build - Barratt London |
Financing a buy to let - Coreco |
 |
 |
 |