
.png)
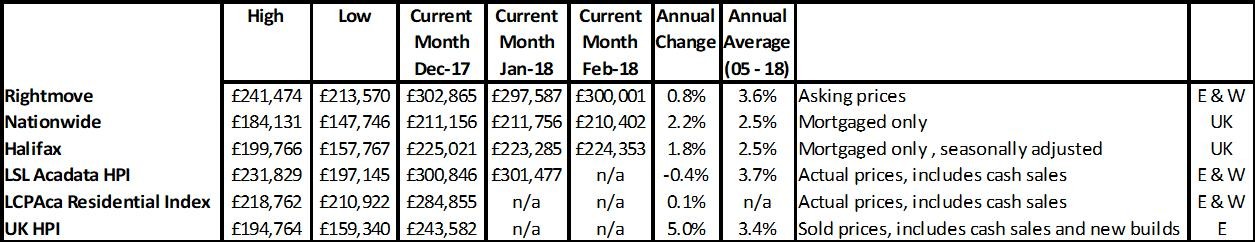
Rightmove “Record home-hunter activity fuels rises in most regions”
NAEA Propertymark “House-hunters flood the market”
RICS “Activity indicators continue to weaken”
Nationwide “House price growth falls back in February”
Halifax “Annual house price growth slows to 1.8%”
LSL Acadata HPI “House prices edge up in January”
LCPAca Residential Index “England & Wales sees biggest quarterly price fall since global financial crisis (GFC)”
Hometrack “UK city house price inflation +5% year on year”
For more on property prices, download my comprehensive update.
There has been some fascinating analysis in the latest round of property price indices and I’m pleased to say that this is mostly around demand, supply and transactions as opposed to ‘average’ house prices which, let’s face it, are now a poor measure of what’s happening in the property market from a buyer, seller and investor basis.
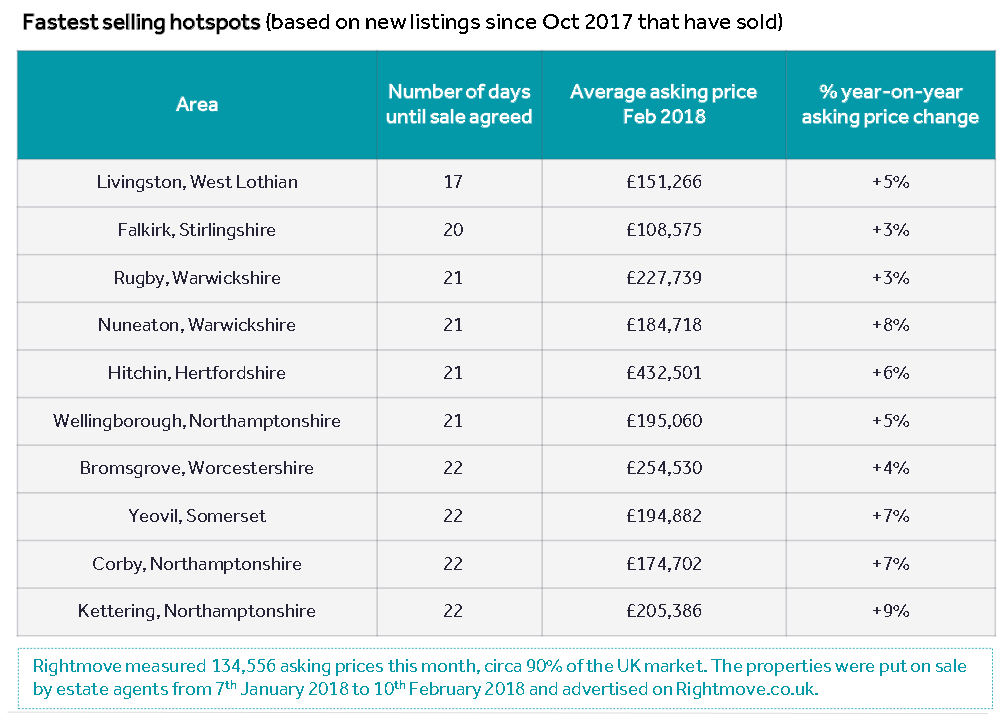
The main figure that affects everyone is the number of transactions – ie how many people are managing to buy and sell – and whether this is currently increasing or decreasing. According to Rightmove, increased home hunter activity is helping a recovery of the number of sales agreed, which in Q4 17 saw an average drop of -5.5% vs the previous year, but this fall was only -1.6% Jan 18 vs 17, with six out of 10 of the fastest selling locations being in the East and West Midlands. Rightmove’s chart shows that in some areas, offers are coming in within 20 days. As this is the fastest, it’s likely your sale will take longer – but if you are not on the market yet, ask each agent how long they think it will take. If it takes much longer than they initially promised, this gives you an opportunity to take them to task as to why it’s taking longer.
As far as how many properties are being sold, Halifax points out that sales are above 100,000 for the 13th month in succession, with January’s transactions of 102,610 being the highest month since April last year. (Source: HMRC, seasonally-adjusted figures).
In summary, sales are holding up nationally with some regional differences.
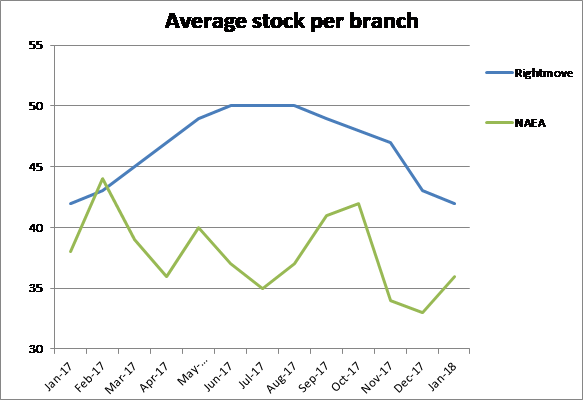
For buyers, according to Rightmove, average properties for sale are 42 per branch; RICS: 40 and the NAEA 36 properties (vs 38 the year before). Although this is lower than pre-2007 levels, these stock levels have remained similar for the last 12 months. Other data from NAEA tells us that “In January, 4% of sales were sold for more than the asking price, down from 7% in January 2017. A fifth (20%) were sold at asking price, and three quarters (76%) at less than asking price”. So as a buyer, it looks like you can make a cheeky offer and as a seller, to sell within a reasonable amount of time, it might be worth making sure you don’t hold out for the asking price..
For more, see our data on the various national price reports.
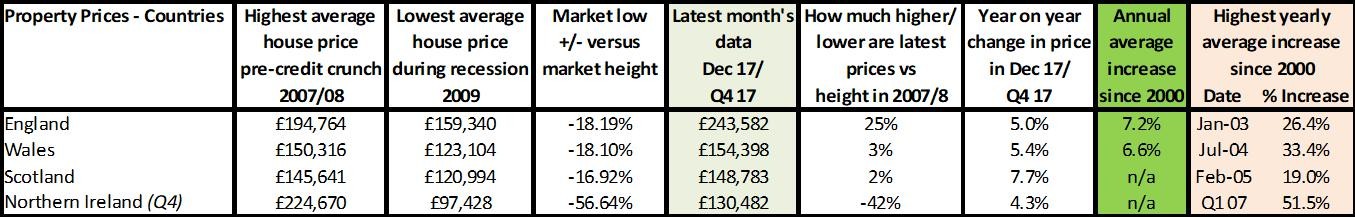
Source: UK HPI
Hometrack offer some interesting analysis on the reasons behind the completely different property price performance between cities since market lows of 2009. The chart below shows that most of the growth seen in London happened in 2014-15 while in cities such as Birmingham and Manchester it was in 2016-17 that growth was achieved; in contrast Aberdeen, with its own unique economy, saw falls during this time.
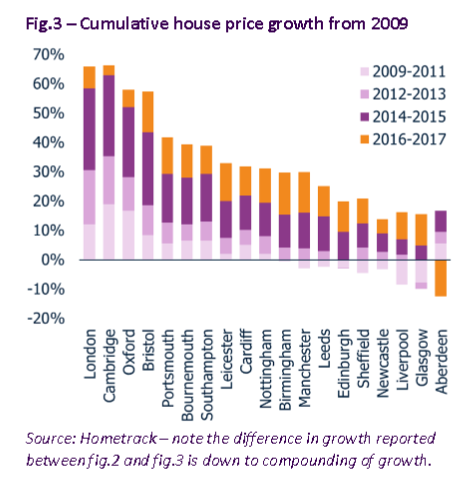
It is no surprise that, from a demand and supply perspective, London, the South and East have slowed, but we need to remember that this comes after major activity since the falls in demand during the recession; the bulk of transactions are now being supported by the Midlands and North which have taken longer to recover.
From a price growth perspective, Hometrack believe that although prices in Midland and Northern cities are unlikely to grow at the rates London have seen due to their lack of high levels of “overseas and investor buying”, Manchester and Birmingham could see growth of 20-30% over the next 3-4 years, while London is likely to “drift lower in real terms in the coming 2-3 years”.
For more on property prices, download my comprehensive update.
Source: UK HPI
It’s clear that regional house prices are being dictated by what’s happening locally economically. The stronger the economy, the faster house prices rise, to a point. However, London and the South are showing that there now appears to be a ‘ceiling’ on how high prices can go that we haven’t necessarily seen in the past. This comes from the changes imposed by the Mortgage Market Review which has created a regime which is sensible on the one hand, but harsh on the other.
For example, restricting the amount of lending at 4.5 x incomes; requiring repayment only and assessing affordability of the mortgage at 6-7% interest, rather than the current low rates of 3-4% can make a massive difference to lending as the following figures show:
What will be interesting over the coming year is to see whether cheaper areas such as the likes of Birmingham and Manchester, which Hometrack predict will see rises of 20-30% over the next 4-5 years, will be able to keep rising in price and how quickly their markets will be affected by these affordability restrictions.
Source: UK HPI
For more, see our comprehensive regional and city data.
Basically what the data is telling us is that although the number and choice for buyers is lower than it has been in the past, we are now seeing what is likely to be a more natural 100,000 sales per month across the UK. Although this is lower than pre-credit crunch when we were seeing sales of 120-140,000, this appears now to be an unusually high amount of sales, likely to be due to the huge amounts of city centre apartments being built and sold.
As a buyer if you have a particular property or street you are after, it’s worth looking on ‘sold property price data’ to see how often properties sell on this road. Some popular streets I’ve looked at show maybe one or two properties sell while in other years there may be no sales at all. Alternatively if you are selling you ideally want to be the only property on the market, so that more buyers are likely to compete than if there are two or more for sale, giving buyers more choice.
Of course, it’s not always possible to time when you buy or put your home on the market, but if you have an idea of whether you are in a fast moving or a slow moving market, how much competition there is for properties like yours (or the one you want to buy) then you can work out the best strategy to make sure you get to buy and/or sell the property you want.
| Buy to let tax - Nicholsons Chartered Accountants | Storing your belongings - Big Yellow | Quick guide to buying and selling - SLC |
 |
 |
 |
