
Rightmove “Muted rise in prices but market moving with 5% uplift in home-hunting”
Home.co.uk “Growth nears zero while London readies for recovery”
NAEA Propertymark “Housing market still moving, despite Brexit woes”
RICS “Near term sentiment continues to deteriorate”
Nationwide “Annual house price growth stagnates in January”
Halifax “Annual house price growth slows at 0.8%”
LSL Acadata HPI “The new North-South divide”
Hometrack “UK city house price inflation 2.7%, half the average annual rate over the last five years”
National prices

For more on property prices, download my comprehensive update.
Nearly all the indices are now heading to a ‘zero’ increase year on year, bar UK HPI which measures the market some months behind the rest. These figures would normally relate to ‘talk’ in the media of a house price crash, but as most of the reports point out, the market is surprisingly resilient considering the level of uncertainty, not just from Brexit but this month from a poor economic performance. The BBC recently reported that our economic growth was at its slowest since 2012, claiming ‘the economy has hit the brakes harder than economists thought it would’. Taking economic and property reports into account, the property market could go one of three ways this year:
1. Bumble along slowly in fits and starts if we don’t get some certainty soon, but economically still remain in positive territory
2. Bounce back quickly for part of the year if we Brexit smoothly
3. Head into recession if there is an economic shock – this may not just be Brexit, but also issues globally such as China’s current ‘weak’ economy
For the most part, many are predicting 1 or 2 as opposed to 3, but you never know and with other issues such as the tenant fee ban coming in this year, in property it’s always worth being prepared for the worst ‘just in case’. In other words, we should have a ‘plan B’ as much as Theresa May is currently trying to find one!
For more, see our data on the various national price reports.

Source: UK HPI
From a country perspective, London and the South and East are holding back growth in England year on year, but since the recession it’s very clear this growth has driven the market well since 2007/8. Although Wales is doing very well year on year according to the UK HPI data, other reports suggest growth is now slowing and it’s a similar picture in Scotland too. It is quite astonishing the property market in these areas – and indeed Northern Ireland continues to do well currently when in comparison to the last 10 years, real versus nominal growth has been non existent. This shows that whatever the market is doing, people do still need to move.
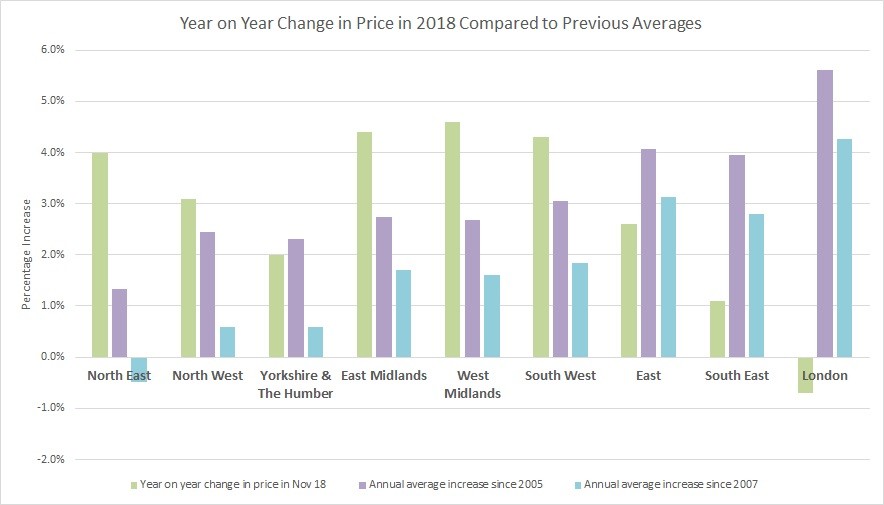
Pre-2005, property prices tended to move ‘in the same direction’. London would grow, then the regions would follow, London falls and so would the regions. The chart below shows that this isn’t the case anymore. This chart compares the year on year changes; average annual changes since the 2007 recession and then back to 2005. This data shows that property price growth is now anything but smooth and certainly hasn’t achieved the previous ‘long term growth’ tracked by Nationwide of property prices outstripping inflation by over 2.5%. In fact, what this information shows, is in many areas, based on annual inflation being around 3% per year since 2005, only the East and London have seen house prices perform above this level and that’s for the last 15 years. In many areas, property prices in real terms have fallen. However as LSL point out at the moment, this doesn’t seem to be affecting consumers: “The fact that house prices in many parts of England & Wales are falling in real terms remains of limited interest to most participants, at least while nominal (actual) gains are still being recorded.” The question is, what will happen when people realise prices aren’t rising at the same level as they were in the past (London and the East are even predicted to slow substantially over the next few years)? Will more people come into the market because affordability is improving or decide renting is a good alternative because in real terms property prices are falling?

Source: UK HPI
From a regional perspective, there are clearly vast differences, but these pale into insignificance when you look at the cities’ data. There is such a stark difference in performance, with the likes of Belfast property prices still 40% lower than they were in 2007, while Newcastle is struggling to gain much ground since 2005. Most cities have kept up with inflation since this time, but only if bought in 2005, anyone buying since that time is likely to have seen negative real property price growth, with only the regular ‘hotspots’ of Oxford, Cambridge, London, Brighton, Reading and Bristol seeing property prices in line with or slightly above inflation increases. Considering more people are owning a home outright these days, it will come as a surprise to them that their property in real terms, is actually worth less than it was 10-15 years ago.
For more, see our comprehensive regional and city data.
Transactions, supply and demand

It’s clear from the stats and report commentary that few places are now seeing any decent transaction growth. LSL are estimating a 2.5% fall in 2018 and as I said earlier, this year could go one of three ways depending what happens with Brexit and at a global level. However, there is no question that so far, transactions have held up probably better than ever before considering the low price growth figures and uncertainty in the market. Feedback from agents for this year and others in the market suggest the demand and supply is still there, but not perhaps the confidence to make offers at the level seen before. The NAEA data sums this up well:
“The supply of properties available to buy increased to the highest level seen for the month of December since 2014.
Demand from prospective buyers and sales to first-time buyers (FTBs) also increased” with “The number of sales agreed per member branch fell from nine in September, eight in October, seven in November to five in December”.
| Buy to let tax - Nicholsons Chartered Accountants | Storing your belongings - Big Yellow | Quick guide to buying and selling - SLC |
 |
 |
 |
