
Rightmove “3.2% price fall over last two months tempts bargain-hunting buyers”
Home.co.uk “2018: A Year of Mixed Fortunes”
NAEA Propertymark “Housing market continues to slow”
RICS “Market activity slips further”
Nationwide “House price growth slows to just 0.5% in 2018, down from 2.6% in 2017”
Halifax “Annual house price growth stable at 1.3%”
LSL Acadata HPI “Biding its time”
LCPAca Residential Index "Market flounders as Brexit uncertainty bites”
Hometrack “UK city house price inflation running at 2.6%, lowest annual growth rate for 5 years”
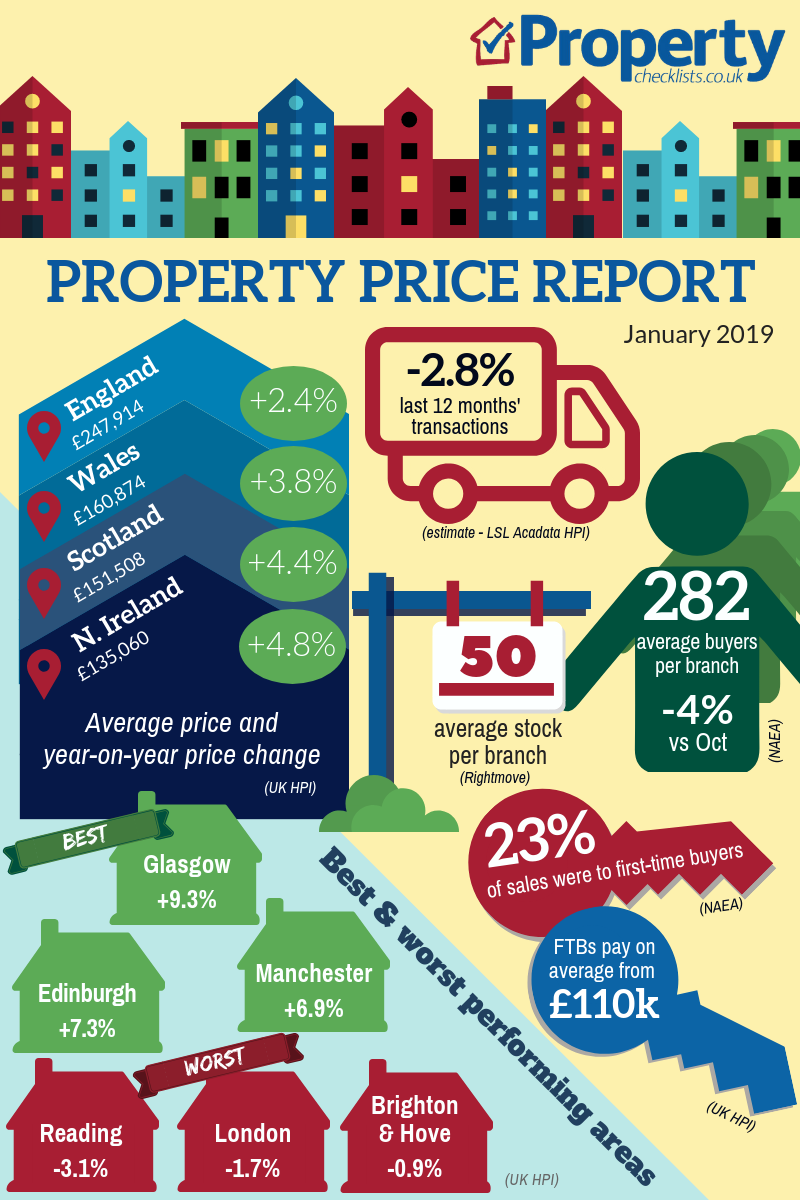
National prices

For more on property prices, download my comprehensive update.
A new year is here and as far as ‘resolutions’ are concerned, it’s pretty impossible to work out what the industry can offer this year to prevent transactions and property prices stagnating even further. All indices suggest that areas which have performed well since the credit crunch, such as London, the South and East of England, are heading into negative territory price and transaction wise and it’s likely to take longer to sell a home. This is with or without a Brexit ‘deal’ happening. Rightmove are suggesting price falls have been ‘larger than usual’ for the time of year, “making this the largest fall over two months for six years”, although they point out the number of sales agreed is ‘surprisingly resilient’.
The RICS point out that while prices are still expected to rise by around 2.3% per annum over the next five years, rents are likely to outstrip this, rising by 3.1%, suggesting that it’s important for the industry to focus on both sales and lettings to survive what is likely to be a tough year.
LSL has looked at sales from a target market perspective, suggesting that the number of loans to first time buyers was up slightly in 2018 (+0.4%) while homemovers were down by -3.6% and of course the ‘buy to let bashing’ has resulted in a -13% fall.
Much of the property market ‘downturn’ is being blamed on the uncertainty of ‘Brexit’ and there is no doubt this is an influence, but it’s more likely that Stamp Duty changes and the harsh attack on buy to let investment as well as traditional market ebbs and flows are bigger influences, and as a result much of ‘where we are now are’ has been predicted for some time.
For more, see our data on the various national price reports.


Source: UK HPI
Northern Ireland is being headlined as a great performer at the moment price wise and indeed ‘tops the country charts’ growth for most indices, but we have to remember this is off the back of huge falls seen during the credit crunch. So although it’s good news, it means little for those buyers/owners who have still seen an average of ‘40%’ wiped off their property’s value. Meanwhile, Wales is seeing a bit of a resurgence. It was one of the latest to go into the credit crunch and as such has taken longer to recover, but performance has been boosted by the likes of Newport which has seen fantastic growth thanks to comparatively wealthy Bristol buyers moving to the area now the Severn Bridge charges have been dropped. This is a great example of how local changes influence local prices and why expert views on the market at a local level are vitally important for buyers and sellers this year. Scotland and the UK continue to move in a positive direction, but England price growth overall is slowing and both are seeing vast regional differences.
We often hear about ‘postcode lotteries’ when describing what happens on a national basis and that’s very true of the property market currently. For some in the industry the next few years are going to be (or continue to be) incredibly tough. Regions such as East of England, the South and parts of London are seeing price falls from a few percent through to falls in Tower Hamlets according to LSL of -13.7% year on year. These are the kind of falls we saw during the credit crunch but at the moment, perhaps due to Brexit, aren’t even hitting the headlines.
The good news is that the RICS expect sales volumes to ‘stabilise’ this year with areas such as Northern Ireland, the South West and even East Anglia seeing ‘positive sales trends’. Price growth is expected to continue in Northern Ireland, Scotland, the Midlands and North West, while London, the South East and East Anglia are likely to see falls.
But performance continues to be very postcode driven. LSL look at London where prices are down in Tower Hamlets by -13.7%, but up by +5.6% in Hackney. In the meantime, areas such as Newham has seen -6.7% falls while Bexley and Barking/Dagenham are seeing around +1.7% and +0.7% increases respectively.
Regionally, the Midlands continues to do well with prices up by +5.3% in the West Midlands and areas in the East Midlands such as Rutland even seeing double digit rises of +10.8%.
Overall, according to LSL, prices are up in 74 of the 108 of unitary authorities in England and Wales outside London.

Source: UK HPI
Individual advice for buyers and sellers is essential in 2019 and the property industry is going to have to work hard to help persuade people to move – whether it’s renting or buying. Much as we don’t ‘panic’ quite as much about the idea of price falls and many consumers are more relaxed than they were pre credit crunch, the stats are confusing and unless explained will hold people back from buying, selling and investing. For example, there will be some owners in London struggling to re-mortgage due to recent price falls, while others who bought some time ago, will have an average of +59% increase in their property’s value since 2007/8. Meanwhile those in the Midlands will have seen good growth year on year if they had bought recently, and great growth if bought at the market low in 2009. However, for those that bought at the market peak, they may only be seeing a +20% rise which is actually, in real terms, a fall. The toughest market though remains the likes of Belfast, Newcastle, Bradford and the North East where prices are still lower than they were 10 years ago, but are also hardly moving forward year on year, with tiny increases of 1-2%. It’s vital that agents and other property professionals explain the pros and cons of moving this year – be it renting or home ownership – and that people understand the difference between small falls that may happen, but if there are larger falls this may mean mortgage lending is tightened so those that would want to access the market may actually find it more difficult if they wait until Brexit uncertainty is over – if that happens any time soon!

Source: UK HPI
For more, see our comprehensive regional and city data.
Transactions, supply and demand

Pretty much every indices and stat on transactions, demand and supply is in the red and that will have been felt across most of the industry over the last few months and is likely to get a little worse over the coming months before it gets better. And, according to LSL’s analysis of UK finance for mortgages, it’s pretty much across the board with first time buyer numbers on a par year on year while homemovers have fallen by -3.6% and BTL of course pulling back by -13%. Overall in England and Wales, for the first ’11 months’ of the year, LSL estimate that transactions are down -2.7%, and are at their “lowest level since 2013”.
And London is seeing some of the toughest falls, with transactions falling by -59% in Tower Hamlets and -21% in Lambeth, while the likes of Hackney and Harrow are up +19%.
The new data source from The Advisory helps to show on a postcode level how well we are performing, with Bristol, Birmingham, Poole and Coventry doing well, while London, Fishguard and even Liverpool seem to be suffering with low demand versus stock levels.
Although all this analysis is helpful to the industry, it’s not so helpful to those looking to make a decision to stay put or move, and it’s important that we do what we can to help people make sense of this data and help them understand that although the ‘stats’ might not be looking ‘great’ at the moment, this doesn’t mean it’s not the right time for them to move.
| Buy to let tax - Nicholsons Chartered Accountants | Storing your belongings - Big Yellow | Quick guide to buying and selling - SLC |
 |
 |
 |
