Since the 1930s average house prices have been produced by the government. The average house price in June 2014 is £172,000 which is 6.5% up on 2013 (Land Registry)
The range of averages between counties and boroughs though is astonishing:-
Top five range between £620,000 and £1,300,000 in 2014:-
Bottom five range between £65,000 and £70,000 in 2014 which include:-
Source: Land Registry
So that’s a 20x difference between Merthyr Tydfil and Kensington and Chelsea in 2014. In 1995 the difference was £34,500 versus £186,000 just 5.5x the difference. No wonder the ‘average’ has gone up so much.
As a further comparison, since 1995 property prices in Merthyr Tydfil were £34,500 and are now £65,000, an 88% increase, while for Kensington and Chelsea, prices have gone from £186,000 to £1,300,000, a 600% increase.
Whilst the effect of changes in Merthyr Tydfil prices will be small because of the low sales volumes in comparison to the effect of sales in Kensington and Chelsea, the Land Registry index says "because it is based on repeat sales is naturally biased towards properties that are sold more frequently" and "is biased towards changes in the price of properties with high turnover." Source: Institute for Fiscal Studies Briefing Note BN 146 May 2014.
So, that’s why an average for England and Wales from Land Registry data just isn’t something that should be used as a comparison. In addition, as you can see above, while house prices have gone up well in the high priced areas, in the lower priced ones they are still falling.
In addition as you can see above, while house prices have gone up well in the high priced areas, in the lower priced ones they are still falling. So it's important to compare local earnings with local house prices. Median earnings should be compared with median, not mean, house prices. Sadly while median house prices exist from companies such as Acadata, regular monthly measures of local earnings do not appear to exist.
Read - How to work out your property market checklist
House prices versus wages
So if we can’t use average house prices as a measure of affordability, should we be using average wages versus average house prices as a measure?
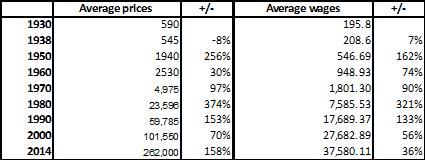
For me the answer is absolutely not. The reason being is if house price averages are distorted, distortion will also apply when you add a wage comparison. Here’s an example of how average prices have grown since 1930s:-
Sources: Yahoo and Table 502+ latest ONS
Clearly the big problem we have now is that wages are not keeping up with what is actually lower than before house price growth when you compare prices to previous decades.
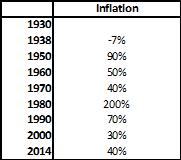
Once you consider inflation between these years it also makes for interesting analysis. It shows that wages have not kept up with inflation for some period of time now.
According to the BBC website, the ONS survey shows “that since April 2000, average annual pay for full-time workers has risen by 40%, from £18,848 to £26,500. In that time, inflation, as measured by changes in the retail prices index, has gone up by 43%.”
So the issue that we have currently is not necessarily property prices rising, but the fact that wages aren’t keeping pace with property price increases as they have in the past. Even worse, the BBC shows “In just five years since April 2007, prices have risen by 18%, while average annual earnings have gone up by just 10%.” See the BBC website for the full article.
Read - Quick guide to selling a home checklist
Is the problem property price growth or wages?
Looking at the long term statistics, it’s definitely a lack of wage growth that’s a problem. Property prices are rising at the same level they have before, it’s wages that aren’t.
When you add to this the fact that the English Housing Survey shows that 50% of people own a property outright in England and 50% with a mortgage, only half the buyers and sellers will be affected by wages versus property prices.
How should we measure affordability?
Because property prices are now so individual, the only real way to measure affordability is to look more at specific careers and then see if different types of properties would be affordable now or not.
We also need to understand how many people are trying to afford to live on their own now, as opposed to as a couple in the past. With things like:
As well as motivators such as better quality rental accommodation (few would have been able to rent a new build in the past) and people not tending to have one or two jobs anymore, but moving frequently either for their career or from one location to another such as UK or even globally.
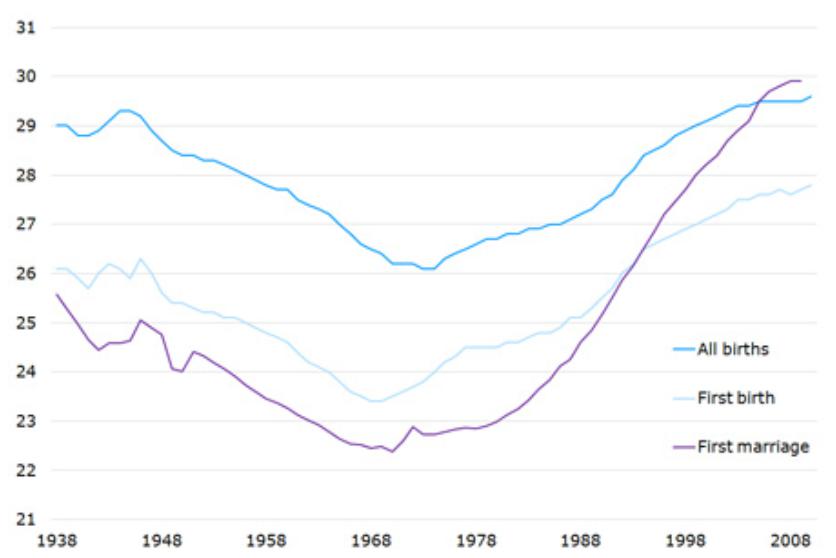
Finally there is the change in the time people do ‘settle down’ as the chart below shows. When the growth in homeownership started, was 23 to 24 years. Now it’s up to 29 to 30, interestingly in line with the average age of a first time buyer.
Source: Parliament.uk
For FREE, independent and up to date advice on buying, selling and renting a home, sign up for FREE to Property Checklists. Join now to access our FREE property checklists, including:-