
.png)
Report headlines
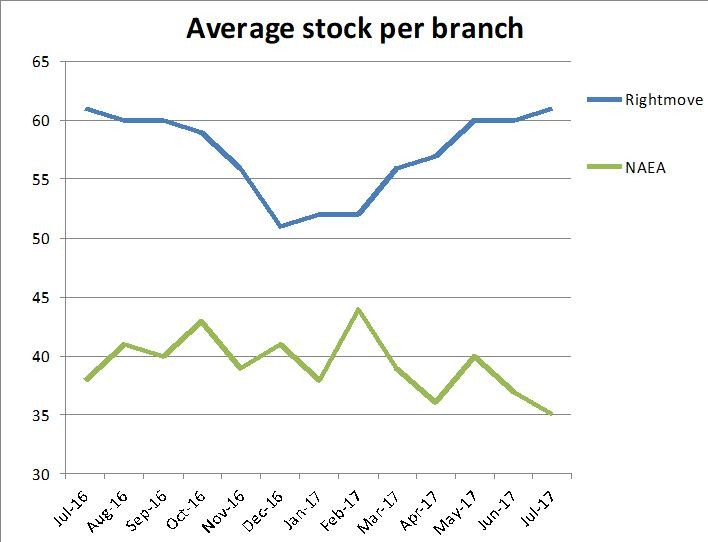
Rightmove “Mid-country hot-spots enjoy mini-boom in annual price growth”
NAEA Propertymark “Summer slump as supply of houses available to buy dips”
RICS “Price growth grinds to a halt”
Nationwide “House price growth slows in August”
Halifax “Annual house price growth picks up to 2.6%”
LSL Acadata HPI “Housing transactions pause for summer holidays”
Hometrack “UK city house price inflation at 5.3%, down from 7.4% in July 2016”
National prices
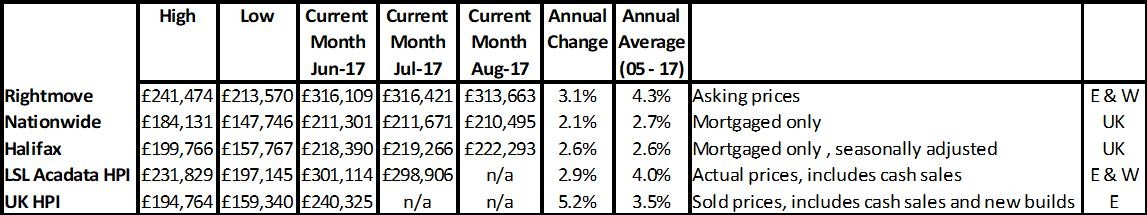
For more on property prices, download my comprehensive update.
Despite the rather conflicting report headlines from Halifax’s cheerful “annual house price growth picks up to 2.6%” through to RICS’s more pessimistic “price growth grinds to a halt”, most of the indices continue to be reporting a slowdown, but still some price growth. Halifax, probably due to low volumes, often differs to other indices so I tend to find their index less reliable, although their longer term research is always very useful. LSL Acadata HPI and Rightmove both point out though we are having “the usual” summer dip. Rightmove analysis shows that since 2010, the last seven years, every year has seen a price fall over the summer of -1.2%. However this year I think it is unlikely that the market is going to see its usual bounce back moving into the autumn.
For more, see our data on the various national price reports.
Regional prices
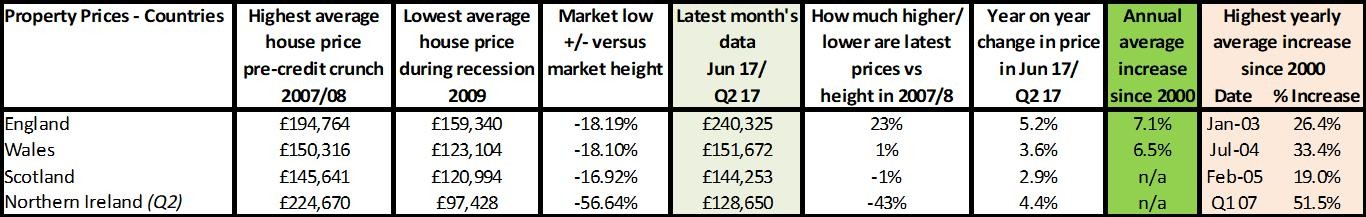
Source: UK HPI
Each country within the UK now performs completely differently, rendering UK data analysis for buyers and sellers (and agents) utterly useless. Wales and Scotland have finally recovered their average house prices from 10 years ago and are seeing slow but solid growth year on year, around 3%. N.Ireland is seeing better year on year growth of 4.4%, with prices being on average 43% down versus 10 years ago on a nominal basis. However, taking account of inflation of 27% since 2007, that means the average in cash terms would need to be £286,000 today – whereas it’s actually 55% less… on average, of course. With some areas now up by over 90% versus the pre credit crunch market height, it’s clear to see how ‘averages’ are just not good enough for those buying and selling.
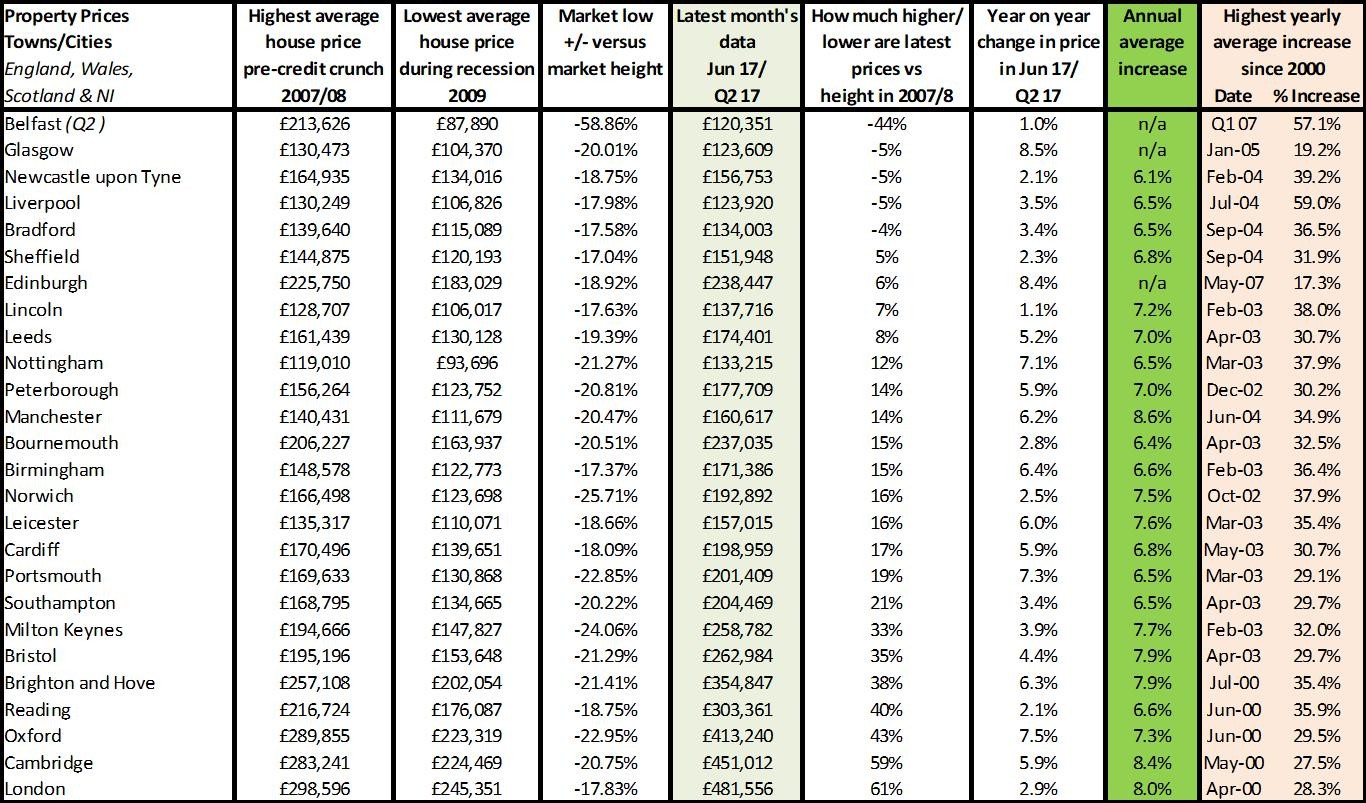
Source: UK HPI
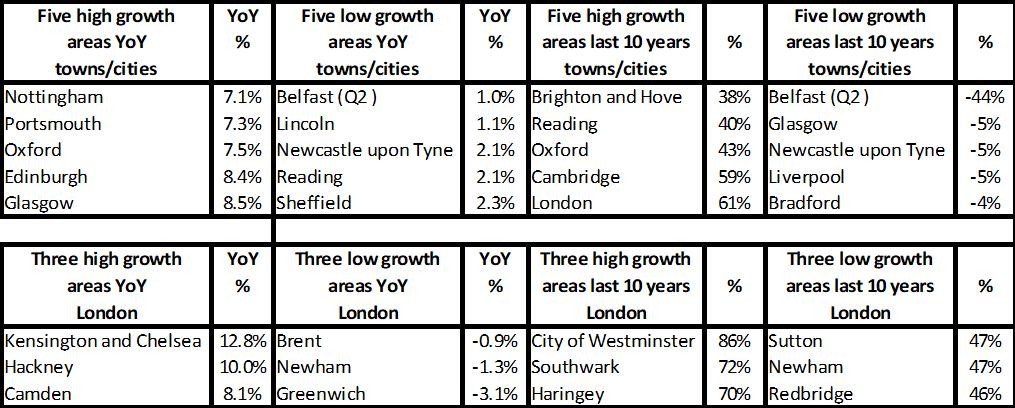
The data regionally is as disparate as the country data. Taking inflation over the last 10 years at 27%, it’s quite clear that only three of our English regions and only seven of our 26 towns and cities are seeing house price growth keeping ahead of inflation.
That means of the 50% plus (EHS) who own their home outright, or who bought to let with cash, are likely to have seen a fall in property values in real terms over the last 10 years. Looking at the year on year and forecasted annual growth rates, although they are still on the up for most, they are not likely to keep up with a 3% inflation average annual rate. Property in the past has been a ‘sure fired’ earner, allowing some people to earn more from their property in a year than their wages. However, now it appears property (on average) is failing to keep up with inflation which may mean investors and home owners think twice about relying on property for their pensions and income in the future.
For more, see our comprehensive regional and city data.
Of course property prices get all the headlines, but it’s volumes that really matter. And, as we can see from the indices, the market is softening despite the historically low supply levels. This is partly due to demand falling post a recession ‘boom’ and partly because of some areas seeing affordability issues choke demand while others are lacking in new buy to let investment. A survey of franchise owners from Belvoir showed that new landlords and investors are not coming through at the same rate as before. However, the good news so far appears to be that existing landlords are not only staying in the market, but some are still actively continuing to grow their portfolios - despite the government squeeze.
For more on property prices, download my comprehensive update.
| Buy to let tax - Nicholsons Chartered Accountants | First-time buyer quick guide - Anthony Pepe | Quick guide to buying and selling - SLC |
 |
 |
 |
