.png)
Report headlines
Rightmove “Buyer choice restricted as supply fails to keep pace with strong sales and buyer demand”Rightmove “Buyer choice restricted as supply fails to keep pace with strong sales and buyer demand”
NAEA Propertymark “House sales up as buyers push through summer property transactions”
RICS “Uncertainty stifles market sentiment”
Nationwide “House price growth broadly stable in July”
Halifax “Annual house price growth eases to 2.1%”
LSL Acadata HPI “Prices cool for summer as north-south divide re-emerges”
Hometrack “Annual growth rate of 5.1% to June 2017”
National prices
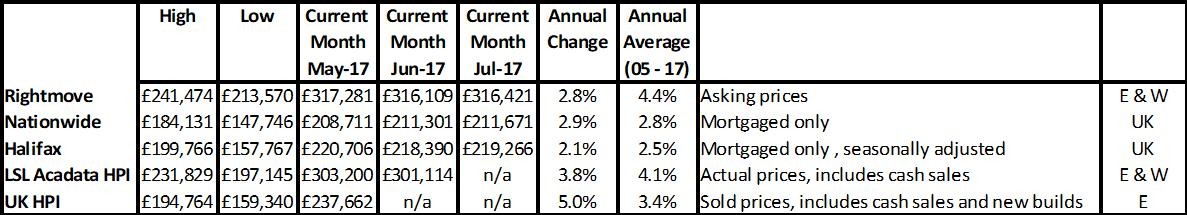
The most fascinating figures are the annual average changes from 2005 to 2017, showing that for mortgage properties, price inflation each year has barely kept up with consumer price inflation (2.9% vs 2.8 and 2.5), when in the past it has always beaten it by some distance. For properties including cash sales, it is still slightly higher with the UK HPI showing 3.4% and the LSL Acadata HPI at just over 4%. However, this is much lower than pre 2005, when prices would typically double every 10 years.
For more on property prices, download my comprehensive update.
Although the headlines are talking about ‘low stock rates’, ‘easing’ and ‘stability’, it’s clear that the 2017 year-on-year growth we are seeing now reflects these long term annualised rates over the last 14 years. And, as we explain later, these lower rates of growth appear to be here to stay. The key point to note from this is that I don’t think the public or indeed investors have appreciated this major shift in national property price growth fortunes and what we need to be prepared for is what happens when they do en masse.
For more, see our data on the various national price reports.
Regional prices
Source: UK HPI
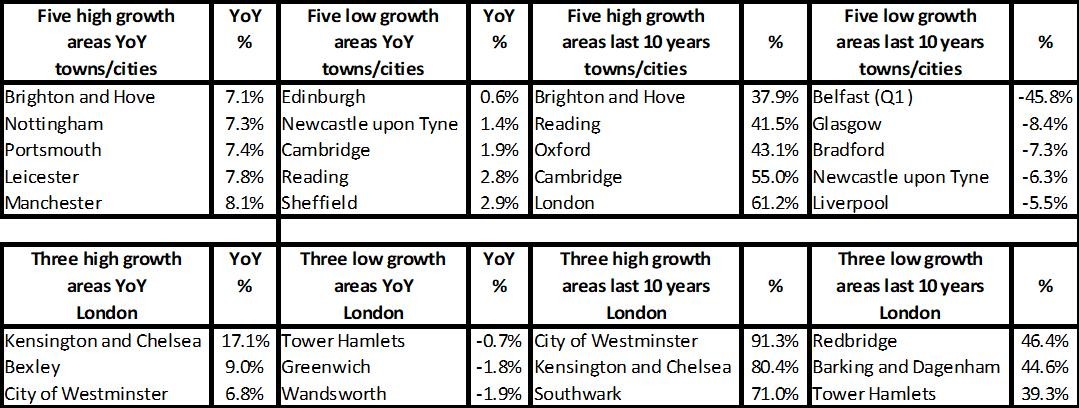
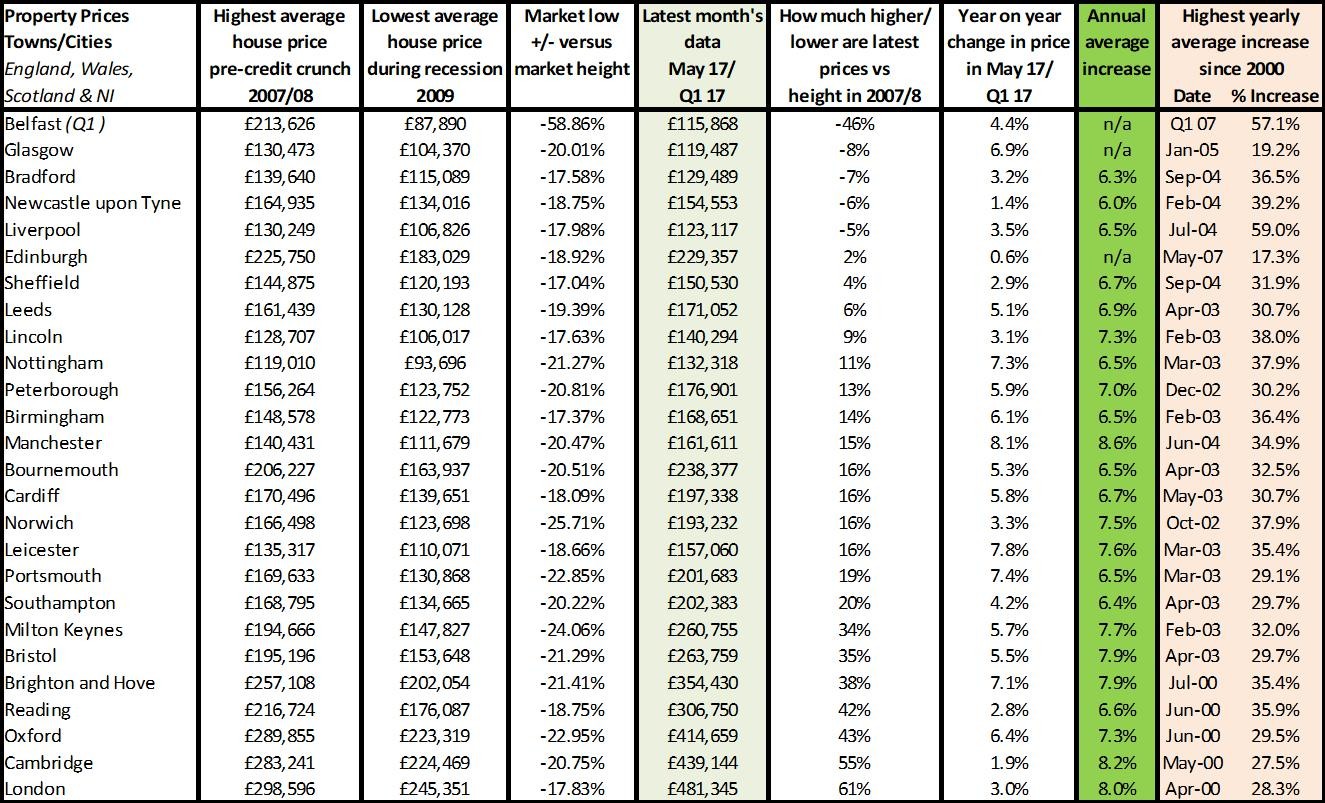
It’s crazy really that with property price changes varying from -45% over the last 10 years in Northern Ireland to -2% in Scotland, no change in 10 years in Wales and a 22% uplift in England, that the indices and therefore media headlines talk about prices ‘easing’ and ‘slowing’. By English Region, we are seeing growth rates year-on-year range from +1.6% in the North East through to in excess of 7% growth in the East and East Midlands and for different towns and cities, eg Leicester, Nottingham and Manchester see over 7% growth. So to try to describe one market currently is, in my view, an extremely out-of-date concept and these headlines can only be described as inaccurate and misleading as they apply to few, if any, areas across the UK.
The indices and media need to come up with a much better way of portraying such a varied performance in the market moving forward if buyers, sellers and investors are going to be given a true reflection of what’s happening in their area. Better still we need to ensure that rather than read or listen to these headlines, people sign up to their local agent newsletters and property price (and rental) reports and read cost-effective local media reports. A marketeer’s dream scenario for agents, brokers and legal companies to take on board.
The good news from the city data though is that most cities are now seeing double-digit growth since the credit crunch, suggesting more are able to move than perhaps in the past due to enough equity growth to help them fund a second or third step, or even downsize.
Source: UK HPI
For more, see our comprehensive regional and city data.
The transaction data shows how hard the property market is to navigate and manage as an industry. Falls of 50% in transactions in any business over the credit crunch were followed by huge increases in demand from 2013 (for some areas) due to the previously subdued recession activity. Now what we are effectively seeing in 2017 is this market resurgence running out of steam and perhaps more steady times ahead. This is good news for those trying to manage their business from a cash, investment and particularly trained staff perspective as it’s better to have a market that is lower in volume but stable than one that increases dramatically one year then falls by 24% as it has in Greater London in the last 12 months (LSL Acadata HPI).
For more on property prices, download my comprehensive update.
| Buy to let tax - Nicholsons Chartered Accountants | First-time buyer quick guide - Anthony Pepe | Quick guide to buying and selling - SLC |
 |
 |
 |
