
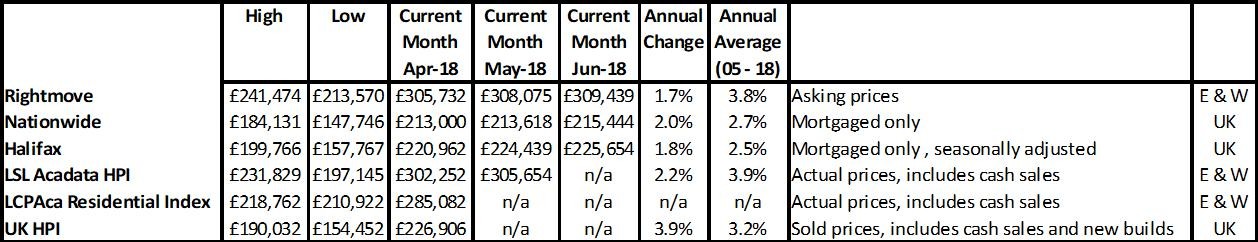
Rightmove “Dwindling stock in north drives prices to new national record”
NAEA Propertymark “Housing market prepares for summer slow-down”
RICS “Activity indicators still point to little impetus”
Nationwide “Annual house price growth slows to a five-year low in June”
Halifax “Annual house price growth remains flat at 1.8% in June”
LSL Acadata HPI “New builds bolster London”
LCPAca Residential Index “Monthly transactions plummet and prices continue to fall”
Hometrack “UK city house price inflation 4.6% year on year”
For more on property prices, download my comprehensive update.
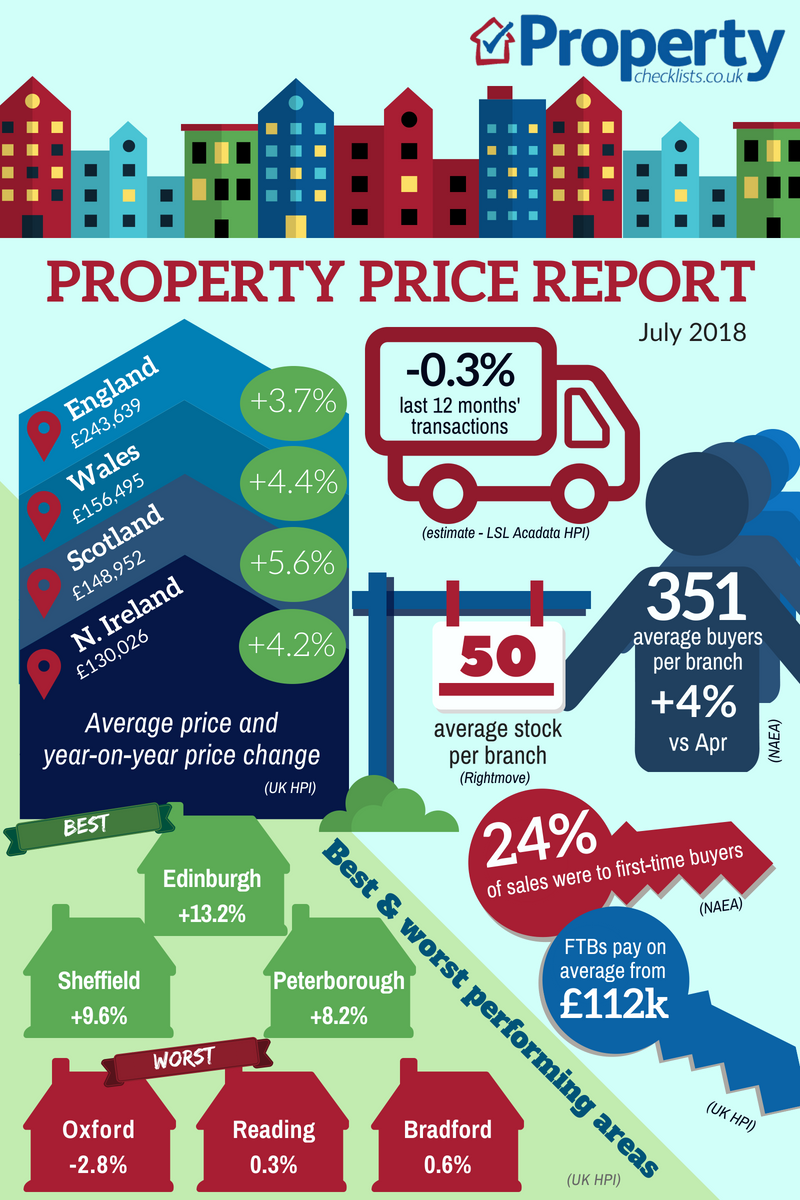
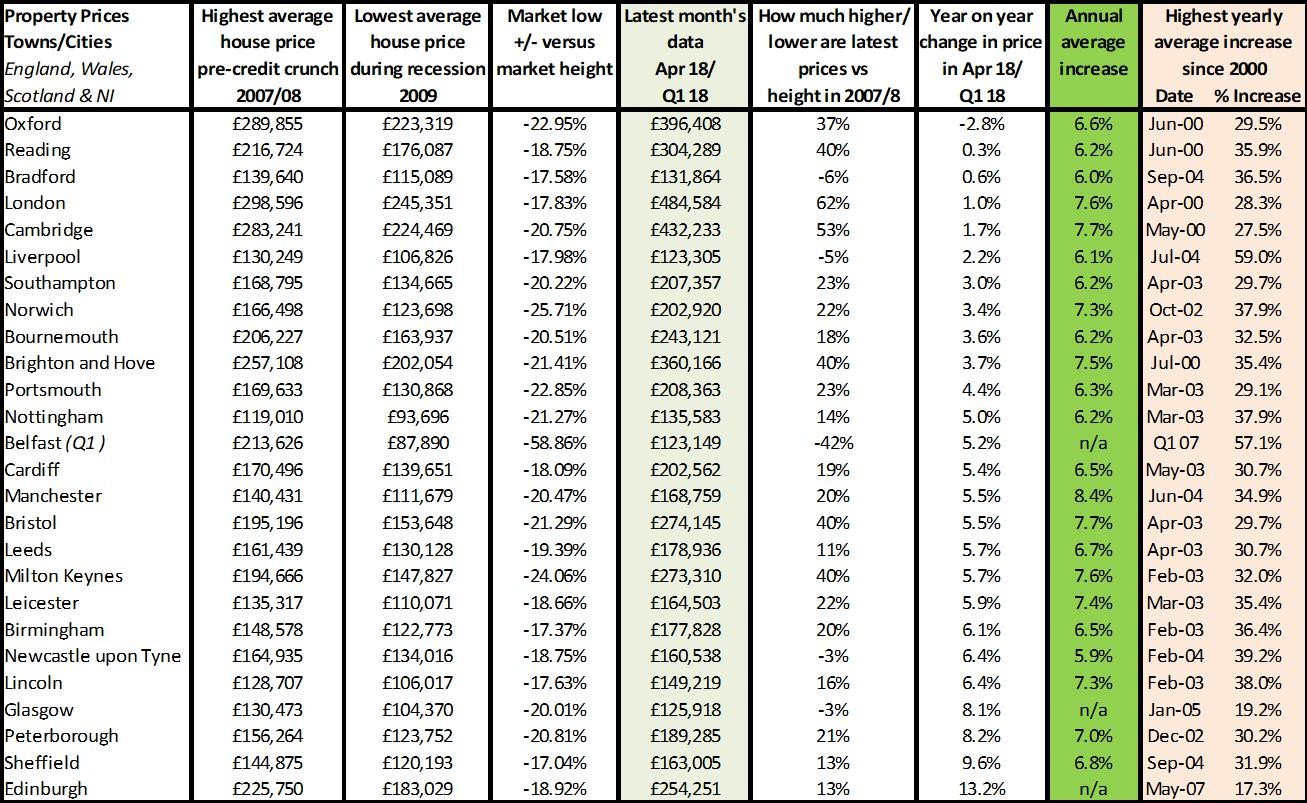
All of the indices this month are pretty much ‘aligned’, agreeing that there is a slowdown both from a transaction perspective and price. However, Rightmove trumpet the North as an area that continues to do well. Year on year that might be the case, but I’ve just finished my regional report on the North East and, according to UK HPI, prices are still down 6% in the last decade, 15% when it comes to flats. From an individual property performance we found one Sunderland flat which had sold in 2006 for £215,000 , but sold again in March 2018 for just £95,000. Obviously we don’t know the reason in this particular case but this level of loss is not hard to find in the North East. What’s more astonishing from the research we’ve been doing is how few first-time buyers are purchasing in the area, despite incredibly affordable properties; this suggests that the fall in first-time buyers and rise in the private rented sector are not just down to affordability.
For more, see our data on the various national price reports.
Source: UK HPI
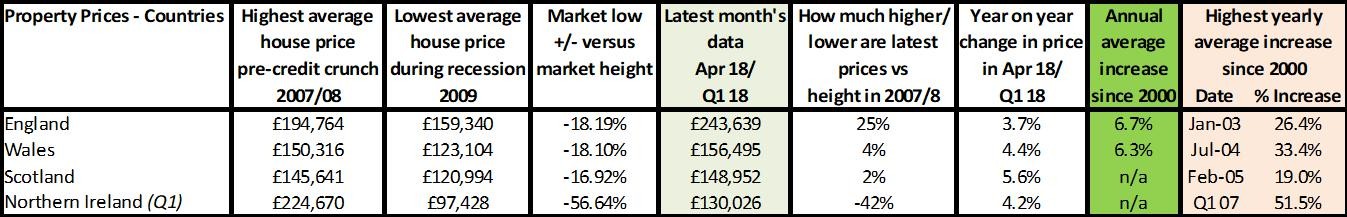
For the first time in a while, England’s performance is the weakest, with Scotland currently storming away at 5.6% growth year on year. Scotland’s performance, though, is incredibly different from one area to another; we are seeing most of this growth driven by a shortage of supply in Edinburgh, while Aberdeen continues to suffer economically, impacting on prices, and Glasgow and other areas such as Dundee remain relatively flat.
For more on property prices, download my comprehensive update.
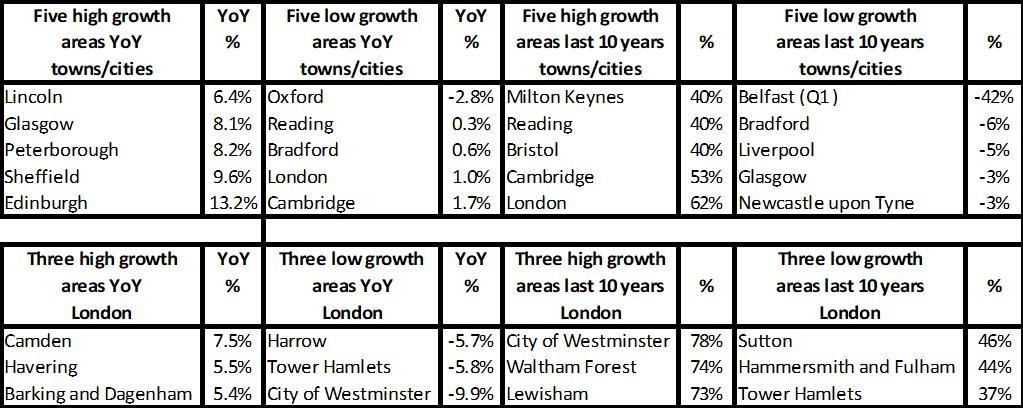
The figures show a fascinating relationship between areas which have dominated the market in the last 10 years – the South, London and the East – which have all seen double-digit growth since the recession but are now seeing low rises year on year and, in London, even some falls. However, the most interesting areas to look at might not be the ones that have the highest growth, but those that are now seeing low year-on-year growth, coupled with only small rises over the last 10 years. The press often ask ‘when’ or ‘if’ a ‘property bubble’ will burst, but what we will find out during the rest of this year is whether it has actually already burst and the future for property price growth is a slow and static one, while transactions are likely to stall.
Source: UK HPI
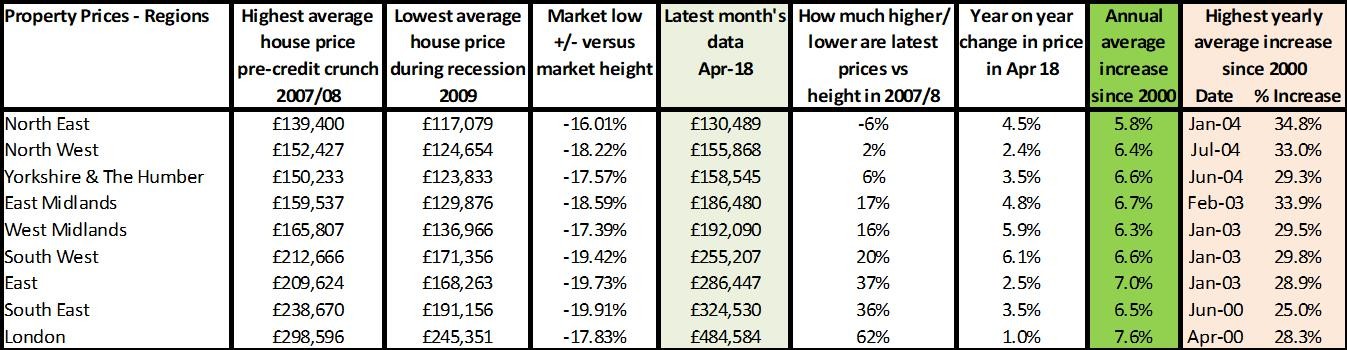
Towns within the regions are following a similar pattern. Only Peterborough, Sheffield and Edinburgh are seeing annual property price growth exceed long term averages of 6-7%. Most areas are now rising around 3-5% and previously strong-performing areas such as Oxford, Reading, London and Cambridge are seeing hardly any growth, along with areas such as Bradford and Liverpool – the latter two areas really struggling to recover to 2007 average prices and not seeing any signs that this might happen soon. In areas like this – the North East, Northern Ireland and places like Glasgow – they must be hoping that talk of a ‘slowdown’ in the market doesn’t mean it stops growing altogether, potentially leaving more people in negative equity or with not enough equity to move if they need to, stagnating their local market.
Source: UK HPI
For more, see our comprehensive regional and city data.
Transactions, supply and demand
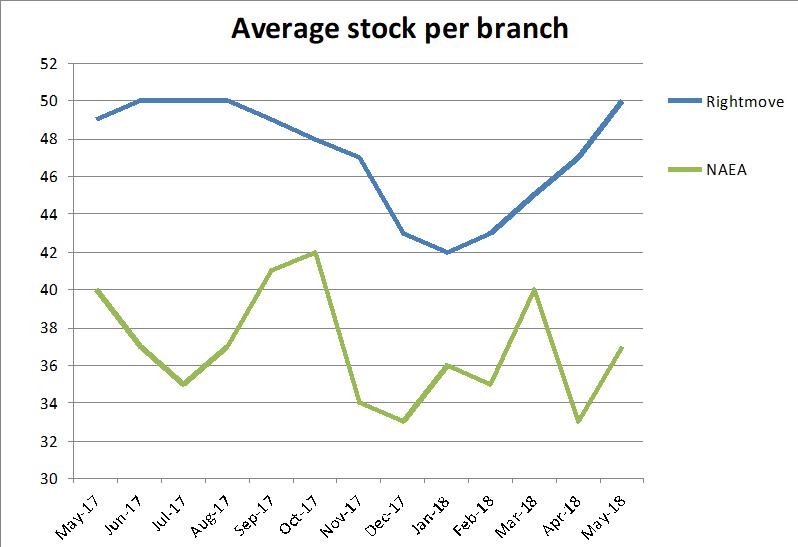
Transactions and stock levels in the market remain subdued and, with a market slowing overall, it’s likely that not just prices will be held back this year, but volumes too. Although it’s difficult to get up to date data from UK HPI, talking to agents and legal companies, most are saying volumes are down year on year and indeed LSL Acadata HPI state: “We estimate that transactions in the first five months of 2018 are 6% below the same period in 2017.”
Typically when the sales market slows, the rental market starts to pick up, but with the clampdown on investment in this sector, this may not provide the ‘boost balance’ it has in the past, so it’s important to understand the reality of the local market and not let ‘trends’ dictate if and when you decide to move; whatever the market, if it’s right for you personally, then it is still possible to move.
| Buy to let tax - Nicholsons Chartered Accountants | Storing your belongings - Big Yellow | Quick guide to buying and selling - SLC |
 |
 |
 |
