
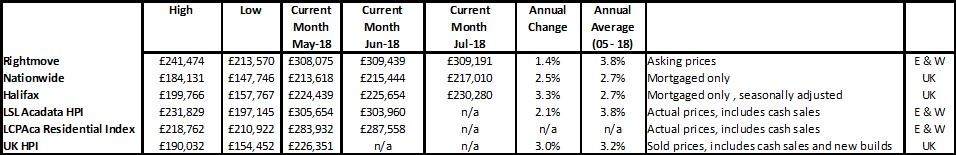
Rightmove “Summer sellers need to work harder as prices stand still”
NAEA Propertymark “Property market bounces back as buyers push through summer transactions”
RICS “Medium term expectations cast doubt on supply response”
Nationwide “July sees modest rebound in annual house price growth”
Halifax “Annual house price growth rises to 3.3% in July”
LSL Acadata HPI “Average house price in England and Wales in June stood at £303,960”
LCPAca Residential Index “Prices fall back from February high”
Hometrack “UK city house price inflation 4.6% year on year ranging from +7.6% to -2.8%.”
For more on property prices, download my comprehensive update.
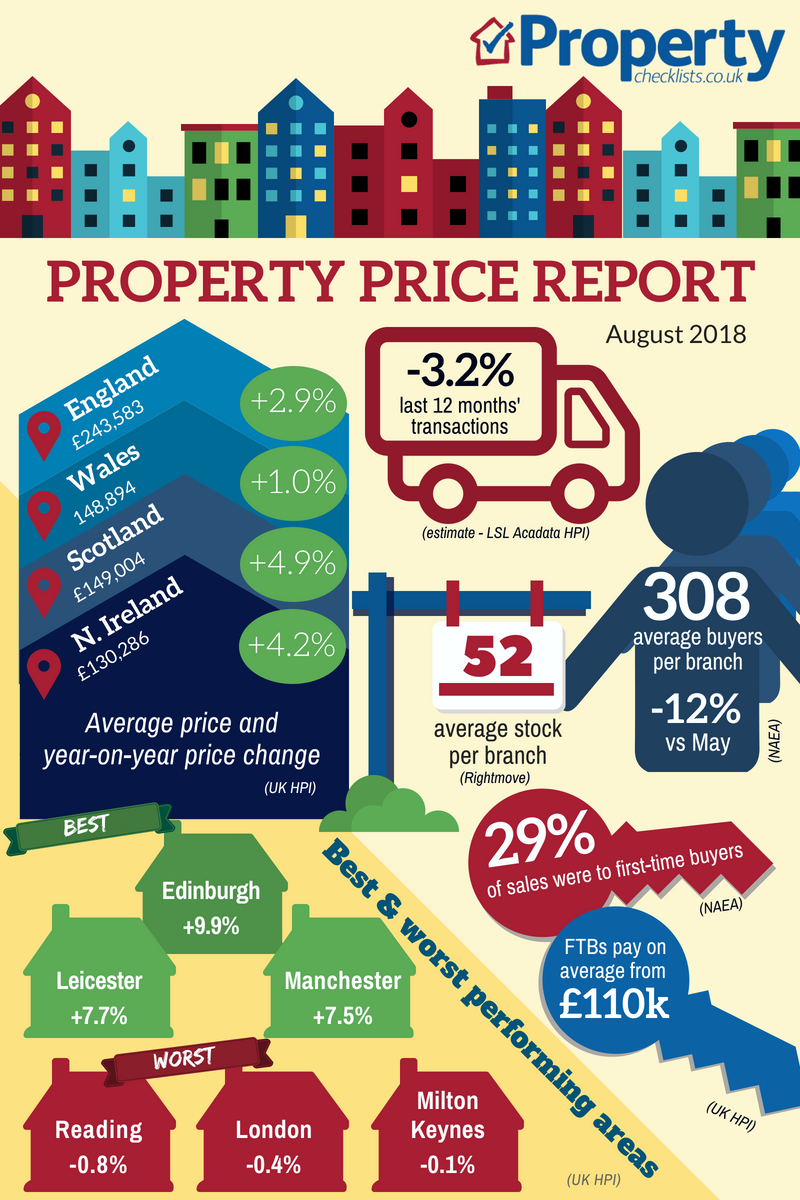
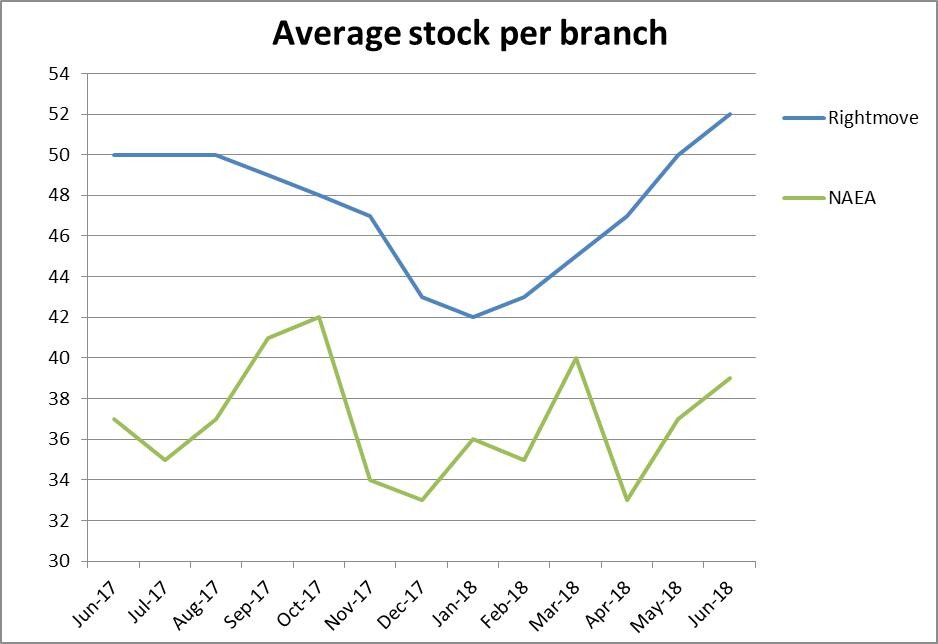
Probably the most significant information from the national reports this month comes from Rightmove, which suggests 8.6% more properties are coming onto the market this month while buyer numbers haven’t increased. This means a much-needed improvement in agent stock levels – back now to the highest level seen since September 2015. Overall this seems to be resulting in stagnating prices, although this is the national picture, which always comes with the health warning of ‘regional differences apply’! Many agents will have a tricky task over the coming months to encourage sellers to put their properties on the market for the right price, rather than what they want or think their property should achieve. Indeed, Rightmove suggest “a third of properties currently on the market have been reduced at least once since they first came on the market”. This is the highest level since 2011, a time when property prices were recorded as flat as a pancake.
For more, see our data on the various national price reports.
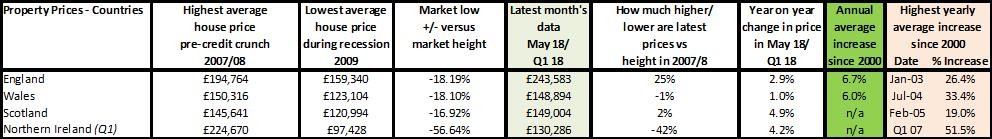
Source: UK HPI
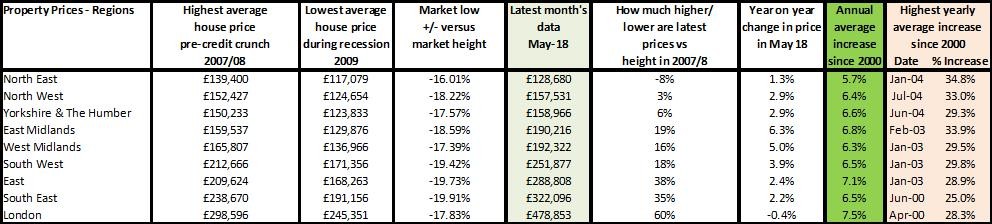
Northern Ireland and Scotland continue to beat Wales and English house price growth year on year, while not really seeing much recovery over the last decade. And with a 2.9% increase in England being made up of a 0.4% fall in London through to a 6.3% increase year on year in East Midlands, the idea that there is ‘one property market’ is proving not just increasingly relevant for property price movements year on year, but also an established historic trend we can see going back as far as 2005. With property prices in each country also growing at 1 to 4.9% we are also seeing a much more long-term lower capital growth trend way below the 6-7% seen historically.
Source: UK HPI
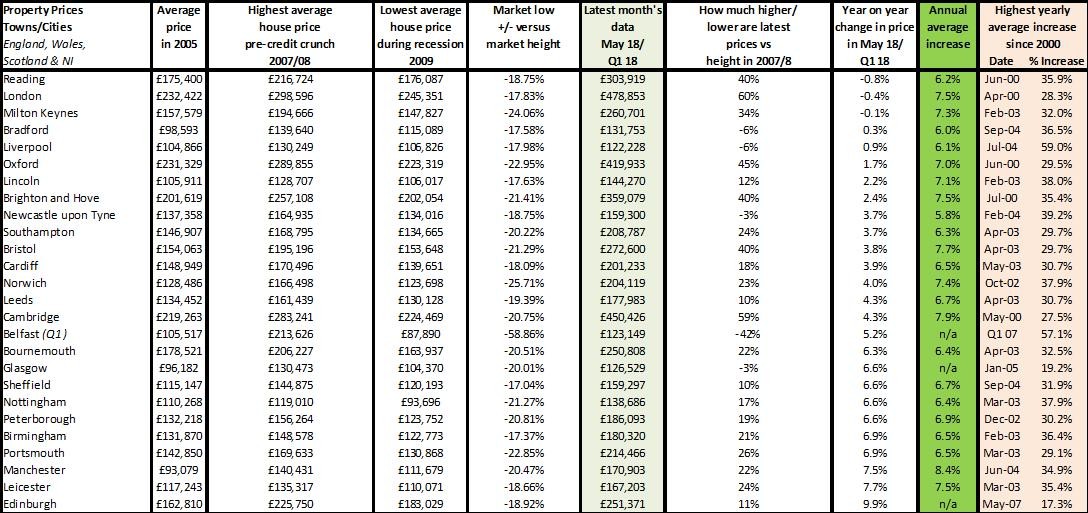
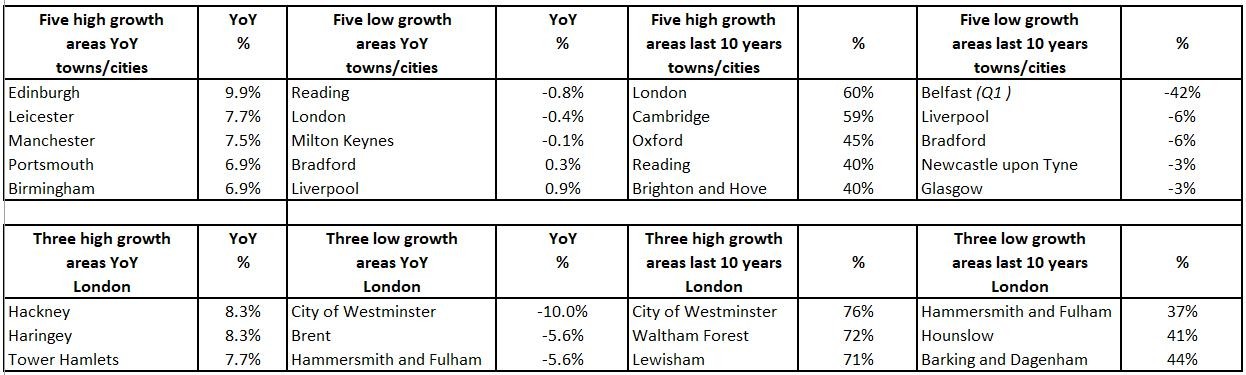
According to the UK HPI, year on year, the biggest fall of the towns we monitor was Reading – showing prices nearly fell by 1%, while being up 40% over the decade. In contrast, Edinburgh saw prices rise by 9.9%, but just up 11% over the decade. It’s a wonder with these kind of changes that we are still reporting year on year and indeed month on month stats so much. Surely what we should be saying is that there are four types of market currently and then advising sellers or buyers to which one the property they are selling or buying belongs:
Source: UK HPI
For more, see our comprehensive regional and city data.
Transactions, supply and demand
Transaction wise, I think we are now seeing the ‘additional demand’ generated from the lack of buying during the recession pretty much flushed through the market. With a loss of 50% of buyers during the credit crunch from 2007, in some areas for as long as five years, it’s not a surprise that transactions grew through to 2017 and are now starting to fall back to, perhaps, more ‘normal’ long-term levels. The question is over the next 12 months with lower capital growth, lower transaction levels, which agents will survive when the loss of business and tenant fees hits? With Countrywide and Foxtons share prices struggling, coupled with more agents ‘going to the wall’ according to several reports, all agents – traditional and online – are going to have to find a way to capture the business that is out there and provide an excellent service to ensure longevity.
| Buy to let tax - Nicholsons Chartered Accountants | Storing your belongings - Big Yellow | Quick guide to buying and selling - SLC |
 |
 |
 |
