
Summary of London property price reports
In 2007 at the height of the market, the London average according to the UK HPI index was £298,596, so today’s average of £481,648 means property prices have grown by 61% in the last 10 years. Since 2000, average prices in London have grown by 8%, if you smooth out all the ups and downs over the last 16/17 years. So it isn’t a surprise that this rapid growth coupled with the ‘caps’ the government has placed on lending through the mortgage market review (MMR) and also by limiting how much lenders can lend to people at 4.5x their earnings, has now meant the London market is finally slowing. That’s what markets do, they often fall (credit crunch), recover and do so sometimes more than they can sustain on-going and then fall back. It’s this latter scenario I think we are in London, as opposed to seeing dramatic falls.
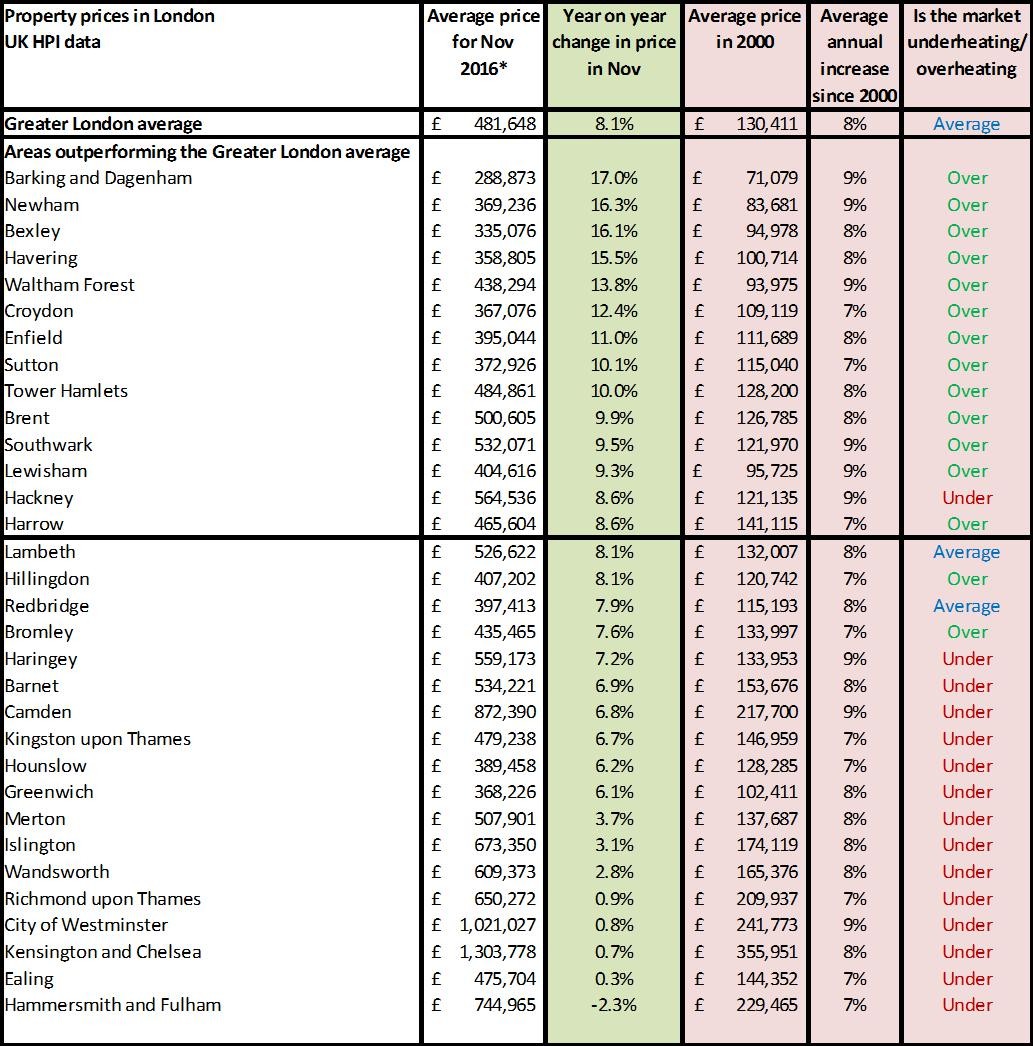
Source: UK HPI
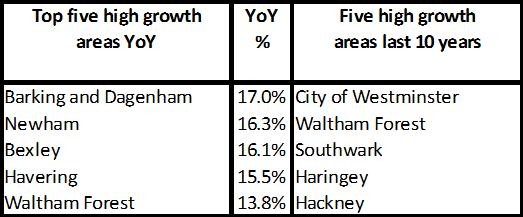
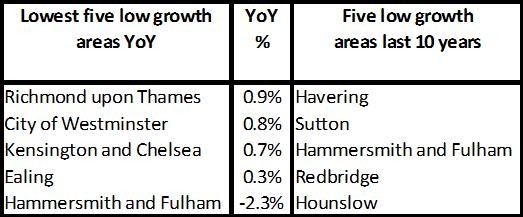
The top five high growth areas left in London are now the areas that have average property prices similar to the average property price for the whole of Greater London 10 years ago with the Barking and Dagenham average at just under £290,000, while the other top performing boroughs have an average of £350,000. These were the last boroughs where property price growth achieved double digits out of the 32 and you can see their growth is slowing already with past year on year growth of 20%+, rather than around the 15% mark. This has been typical of property price growth in each of the boroughs. The growth kicks in after the credit crunch, it takes off as people offer more and more money to secure a property for fear they won’t be able to buy in the future, then as prices hit affordability barriers, prices slow and people start to talk about a crash, lowering demand even further. What will be interesting to see in the future is if the changes to buy to let taxation will hit demand at all levels of the market, as changes to stamp duty at the premium end of the market has hit demand, lowering price pressure so much, in some areas such as Hammersmith and Fulham it has gone into reverse. Savills believe the prime markets will remain slow until around 2019 when they expect all property price growth to pick up.
For more download Kate's comprehensive London update.
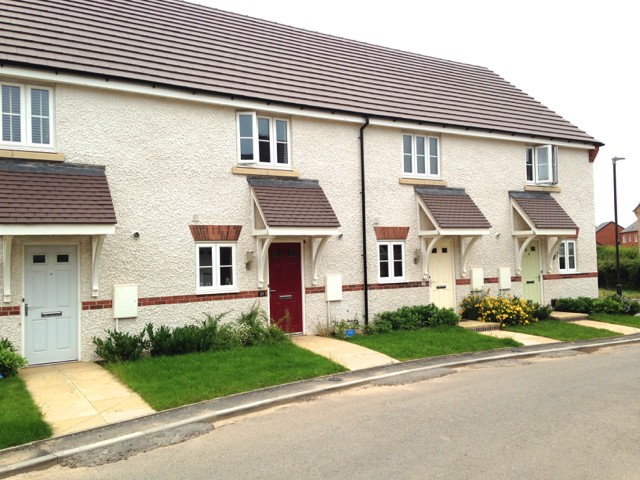
It costs a lot to build a new property in London
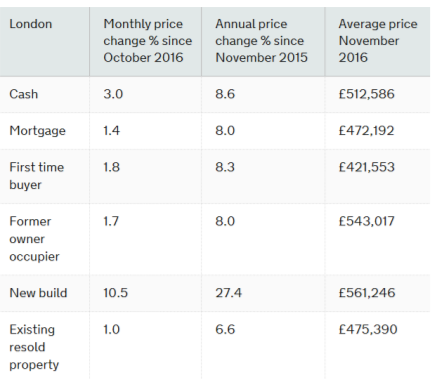
What the chart below shows is that overall, property prices across the different types of buyers has risen a little year on year, but it’s the new build prices that continue to increase at a faster pace. This is an issue, as one of the main causes of price growth in London is lack of stock versus increased wealth (for some) and this constantly drives up prices. However, building a new property in London costs so much money due to the fees for land and then the high cost to build on what is always typically brownfield sites which take hours to get to and from. As such, new build average prices are 18% higher according to the UK HPI index than existing homes re-sold and the inflation rate continues to rise faster than other property sales. This shows the importance of the London Mayor’s affordable homes programme, who plans to build 90,000 affordable homes over the next five years.
Looking at a new build? Read our help to buy a new build checklist.
The programme states that:-
The 90,000 affordable homes will be a mix of low-cost rent, shared ownership and London Living Rent, which is based on a third of average household incomes in each borough.
Most homes in the Mayor's programme will be delivered by housing associations, with the condition that their plans must include a minimum 50 per cent affordable housing, with some partners enabled to deliver at least 60 per cent.
So for those who feel they have been priced out of the housing market in London for good, this may well deliver some good news and it is worth keeping up to date with new schemes in and around London via local newspapers and bespoke magazines and shows run by the likes of the First Time Buyer.
Source: UK HPI
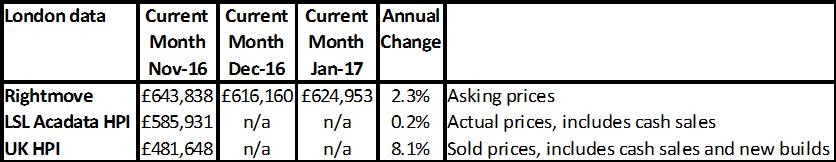
The Rightmove data below shows that using ‘averages’ for London itself is really pointless; individual purchases by different groups in different boroughs is the only real way to gauge property prices in the London area.
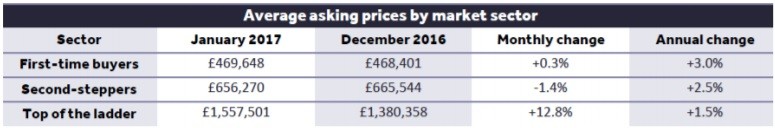
Source: Rightmove HPI
Supply and demand for the London market
As with most capital cities in the majority of countries across the world, there are two types of buyer. There are those that are global, wealthy investors who can ‘hedge their bets’ on which capital city will outperform the other, and there are those who just want to put a roof over their head and have a decent journey time to work which allows them to still have some downtime.
Currently the supply and demand for the global investor has tipped in favour of buyers, and this is expected to remain due to the high levels of taxation compared to other countries people have to pay to own property in the UK and of course due to the uncertainty of Brexit. However, the market is expected to come back by 2019, according to Savills.
The domestic market though remains strong from a demand perspective mainly because there are nowhere near enough homes being built to accommodate the growth in population. The London Mayor drives the housing policy and his focus is now firmly on creating more affordable homes, planning to boost supply by up to 90,000 properties. This is on top of an already ambitious shared ownership programme which is starting to achieve some results.
You can see where areas of ‘opportunity’ are being targeted in the London Plan and if you want to get on the housing ladder in the next few years in London, then now is the time to start looking to see what will be in your price bracket – ignore all the scary news that you will never be able to afford to buy. Put in a search currently for shared ownership properties in London up to £200,000 in Rightmove, and although it’s not many, there are 44 currently on offer.
For more download Kate's comprehensive London update.
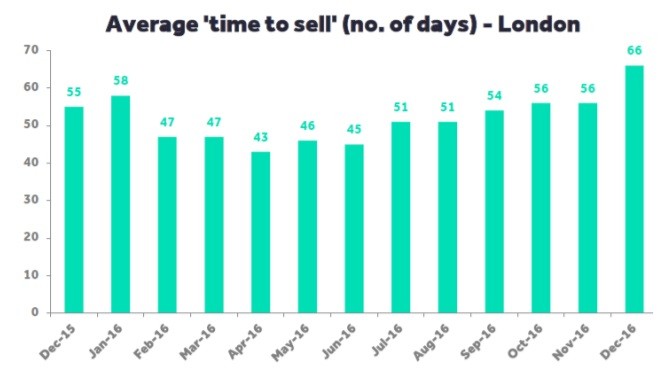
For anyone selling in London in 2017, it is likely you will have to price keenly and make sure you attract the buyers that are still willing to commit despite an uncertain market.
Looking to sell sharpish? Read our how to sell quickly checklist.
Sales volumes for London
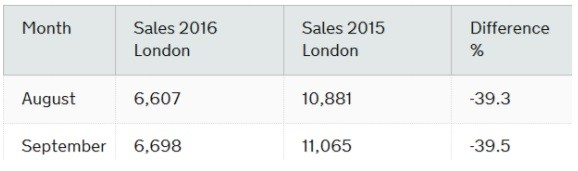
Source: UK HPI
Source: Rightmove HPI
Current performance by individual London borough
The table below shows how your borough is performing year on year now and whether this performance is above or below the long term annual increase.
Source: UK HPI
