
Hallelujah! the BBC has produced some data which backs up what I’ve been saying for years: that house prices are not rising as much as the media suggest and property prices are very specific to each property and small locations, such as a ‘ward’ which covers a small area.
Taking inflation into account, the data shows that while house prices have risen in most regions, they have not kept up so, in real terms, they are lower than they were 10 years ago in more than half of wards across England and Wales.
I was invited onto BBC Radio 4’s You and Yours programme to talk about the data with presenter Winifred Robinson.
Official figures were analysed by the BBC data team and the Open Date Institute (ODI) Leeds, who examined more than 8m residential property transactions – excluding buy to let where possible – from 2007 to July 2017.
Some of the findings included:
London, South-East England and East of England have all seen rising house prices – eg in Hackney, even taking inflation into account, prices have doubled in 10 years
Falls of more than 10%, adjusted for inflation, have been seen in Wales, Yorkshire and Humberside, and England’s North-East and North-West
In North Ormesby in Middlesbrough – the cheapest ward in the country – you could buy 80 homes for the price of one home in prime central London
When adjusted for inflation, the price of an average home in England and Wales has remained flat since 2007
Of the 500 neighbourhoods where prices have increased most, only 21 were outside London, the South East and East of England
None of the 500 neighbourhoods where prices have decreased most are in London
The biggest price increase has been in Dalgarno, Kensington and Chelsea, where the average house cost £1.2m in 2017
The biggest price decrease was in Aberdulais, Neath Port Talbot in Wales, where the average house cost £65,000 in 2017, less than half of its 2007 price, £143,000
As I’ve been saying for years, reports of house prices rising year on year – and talk of house price averages – are misleading. What matters is what your property is worth today and whether it will sell or rent to allow you to move on when you need.
The BBC has created a calculator based on the data, so you can check how prices have performed, in real terms with inflation taken into account, in your electoral ward.
The North/South divide was highlighted by a listener who purchased an apartment in Sheffield in 2007 for £280,000, which is now worth around £170,000. At the same time, his daughter bought a similar property for £280,000 in Hackney, which is now valued at £700,000.
What does the data mean for homeowners in different parts of the country?
If you live in the Midlands or further north, this is actually good news to some extent. What is frustrating to me is that young people are constantly being told they cannot afford to buy a home, so many of them don’t even try.
But this data shows that actually for many of those in the top half of the country, it’s a very real possibility.
The BBC data only looked at England and Wales but the news isn’t too bad in Scotland, if you are looking to buy, as prices are just starting to recover there. Prices are now about 2% above the high of 2007, but this does mean, when you take into account 27% inflation over the last 10 years, they are about 30% lower
Northern Ireland prices are still down from 2007 by 43% even before you adjust for inflation, so some people hoping their home would be an investment will be disappointed, unfortunately.
Why have prices fallen so sharply in some areas?
There are anything up to 50 factors affecting house prices, including overpricing of properties in the bubble prior to the housing crash. But breaking this down to the key factors, it’s about local supply, demand and wealth including wages and equity.
Where supply matches demand and there is not much wealth, prices will remain relatively static
Where the economy isn’t doing so well, house prices could fall and we have to remember this is good news for those not yet on the ladder
Where the economy is doing well and there is a shortage of supply versus demand for property, house prices are likely to rise as long as there is the wealth to pay.
This is why prices have risen so dramatically in areas such as Kensington and Chelsea – where there is almost unlimited wealth being pumped in, a tight supply and huge demand so every property is effectively sold to the highest bidder. However, at the moment even this area is not performing too well, suffering from a lack of demand, perhaps driven by the likes of Brexit uncertainty and increased property taxation at the prime end of the market.
What is the ‘Malteser Market’?
I’ve spoken before of the ‘Malteser Market’, which is made up of thousands of tiny bubbles and areas will always have pockets which buck the trend.
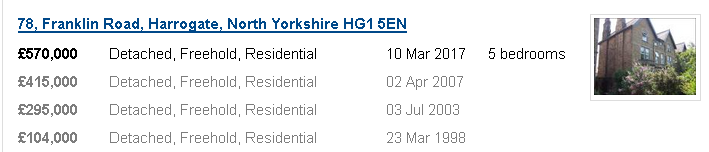
For instance, Yorkshire and Humber has seen inflation-adjusted falls of just over 30% in the last 10 years, but prices for some properties in Harrogate are rising. I found a five-bedroomed property there that’s grown in price by 37% since the crash. That’s due to properties like this being in short supply, lots of demand and people with good salaries and equity to spend.
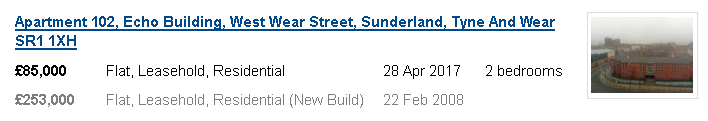
Meanwhile, in Sunderland, a flat which sold for £253,000 in 2008 would need to be worth £321,000 now to have kept up with inflation, and yet it sold in April 2017 for just £85,000.
Why don’t people want to live in rural areas?
Callers to the show reported suggested problems selling property in rural Lincolnshire and, in my view, this is because city life certainly seems to be more popular across generations that may have ‘escaped to the country’ in the past.
This is an area which I feel needs greater research but anecdotally I think people’s housing needs are more driven by lifestyle – restaurants, theatres, evening entertainment – than trying to buy the most expensive and biggest property they could which was the aim often of my parents’ generation.
How do homeowners find out what’s happening in their area?
The BBC data shows that if you want to know what’s happening to prices for a property you are selling or buying, it’s essential to do your own research.
The good news is you can do this yourself free of charge!
Use the BBC’s house price calculator to see if prices have risen or fallen in your neighbourhood, with adjustments for inflation
Research sold property price data online, eg through Rightmove, you just need a postcode
Talk to local agents as they have unrivalled insights into the local property market and will understand supply and demand, which have such an influence on prices.
What can be done about the North/South divide?
We need a plan to drive economic growth to individual areas and investment in transport should go some way towards addressing that.
But with the rise of remote working, I think people working in London and the South East should seriously consider if they need to live there. These areas could almost find themselves in trouble as more wealth could be driven to the Midlands and further north.
I moved back to Nottingham from London purely because of house prices – and I’m still only an hour away from the capital.
Where does renting fit into the picture?
Renters are constantly being made to feel inferior and that they should be getting onto the property ladder but I think this is totally the wrong message to send out. For many people, renting is a far better option than buying. On top of this, we’re seeing a growing rental market due to greater numbers of students, migrant workers and people on council waiting lists as we haven’t built enough social homes.
In fact, tenants should be pretty pleased with themselves – while prices have been falling in real terms, they have been paying rent without having to contribute to maintenance costs.
What are the key takeaways from the BBC data?
As I’ve been saying for years, ‘averages’ are pretty much a waste of time. Prime property in London will skew the figures for everyone
Year on year figures are also misleading – we need to look at the bigger picture, and this inflation-adjusted data is really useful for that, as well as look at market highs, lows and whether a market is over or underperforming
Property isn’t always an investment – it is no longer true that all house prices double every 10 years, despite what people tell you!
| Buy to let tax - Nicholsons Chartered Accountants | How to choose a mortgage broker - Which? Mortgage Advisers | Quick guide to buying and selling - SLC |
 |
 |
 |
