The word ‘stable’ to describe the property market has been used by many of the indices over the last few months – but no-one is describing the market as ‘strong’ and the most negative title comes from Home.co.uk which suggests the “Slowdown worsens as prices slip further into the red”. What most indices agree on is that in today’s market people just aren’t being forced to sell, mainly due to rock bottom mortgage rates. As such, when demand falls, so does supply, lessening the impact of potential price falls, so the market slows as opposed to seeing falls which, when reported, can drive the market down lower. Most of the indices also agree that prices have pretty much ‘topped out’ across the UK with perhaps the odd exception of some areas in the North and Northern Ireland, which still has a long way to go to recover from its price bubble bursting in the credit crunch.
For more in-depth analysis, read Kate's report here
Wales is our top performer this month with prices year on year heading above the long term average to 6.7%. This is great news for those who have bought since the market low in 2009, but with most home owners in Wales owning for 22.6 years, this won’t mean much, especially as those that bought in 2007/8 will find average house prices are just 9% higher than they were 12 years ago. Meanwhile, Northern Ireland prices continue to rise, but from their very low base. 12 years on from the recession, prices on average are still 40% lower.
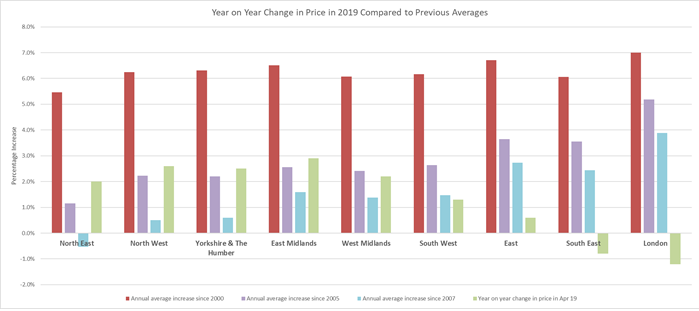
With England prices showing hardly any movement in the last 12 months, you can see where the market description of ‘stable’ comes from. However, breaking prices down by region shows the vastly different performances. The most shocking stat is from the North East - very often ignored by the media. Prices are up just 2% year on year but are still down by 6% versus 12 years ago. It has to be asked if affordability is the real driver of a loss of first time buyers, why have so many been lost in the North East vs other regions? The North West and Yorkshire and The Humber are in a similar position, albeit with property prices 6-7% higher than 12 years ago, but again, first time buyer levels in both these areas have still fallen, despite prices being pretty reasonable. Hometrack does some interesting analysis on the affordability changes of FTBs, comparing 2016 to 2019 and concluding that “the income to buy for a first-time buyer has fallen in the most expensive cities. The level and change in the income to buy explain recent trends in the development of price growth and the outlook.” Suggesting cities like Newcastle don’t require any more income to purchase than they did three years ago.
For a full analysis, read Kate's report here

Source: UK HPI
The latest towns and cities’ data shows how Hometrack’s income analysis does affect property prices. In Liverpool, we have seen serious growth year on year of 7.9% (LR) and 5% according to Hometrack. This is also the city which requires the lowest incomes to buy, allowing people to get on the ladder more easily, followed by Glasgow and Newcastle. Meanwhile, where prices have run away in the past in towns/cities like Reading, Cambridge and parts of London, prices are now heading backwards price wise to compensate for overheating versus affordability. Eventually though they will drop back far enough for demand to start to be rejuvenated, particularly if the fears of Brexit are overcome over the coming months.
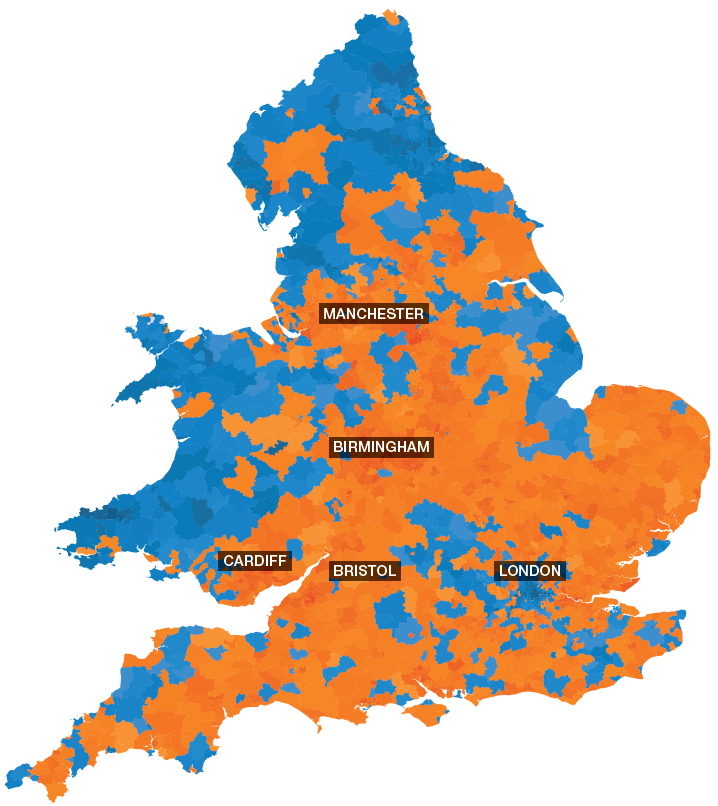
And it’s not just prices that ‘stable’ applies too, but most indices are also pointing to quite stable demand and supply. The NAEA stats this month look very positive, with the number of sales agreed “rising from an average of eight per branch in April, to nine in May”. According to the NAEA, this is higher than when Brexit fears really hit the market last September. Overall, most indices are reporting steady to slightly falling volumes. RICS surveyors suggest that new buyer enquiries were virtually unchanged versus April, while sales did continue to slip a little, but less so than in recent months. The PropCast data shows how diverse the markets look within cities and towns on a postcode basis, with some such as parts of Bristol, Poole, Manchester and Sheffield showing they are still a seller’s market, while many others have definitely shifted to a buyer’s market, such as London and parts of Liverpool.


Source: The Advisory
| The legals of buying & selling a home - The Society of Licensed Conveyancers |
Passing on your property wealth - Chase de Vere |
Help to Buy a new build - Barratt London |
 |
 |
 |