
The English Housing Survey (EHS) is one of the most interesting and useful reports on our housing stock that exists. Here is my summary of the latest findings for housing in England, plus a few of my thoughts.
A more detailed analysis will follow when the full report comes out in the summer.
Tenure: how do people put a roof over their heads?
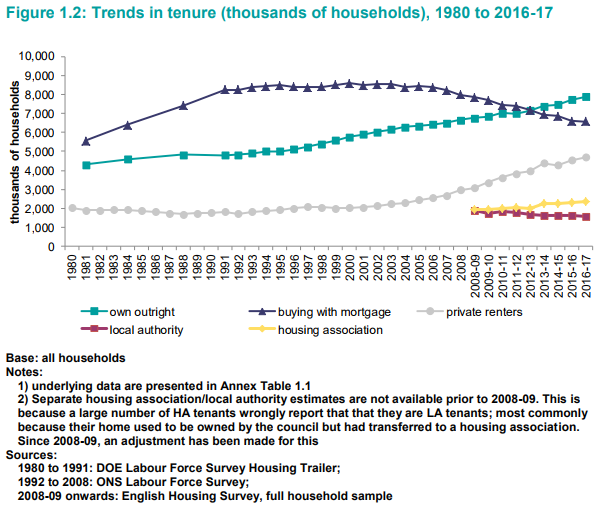
As of 2016-17 there were 23.1 million households, an increase from 22.5 million in 2015-16.
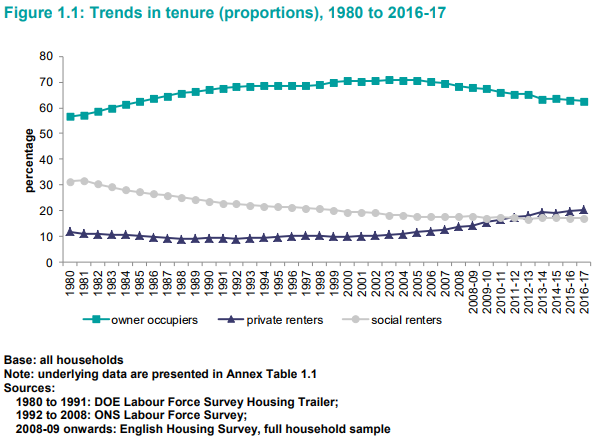
The majority of these remain owner-occupier households, 63%, unchanged since 2013-14 but below the peak level of 71% in 2003.
Key points:
Owner occupation is comprised of two groups, outright owners and mortgagors.
In 2016-17, 34% of households were owners and 28% were mortgagors.
In 2016/17 the PRS made up 20% of households.
Prior to this, during the 1980s & 90s it was around 10%, but has doubled since 2002.
The social rented sector (SRS) remained the smallest tenure in 16-17 at 17% of households.
The proportion of SRS has fallen in the last 10 years, but is plateauing.
In 2008-09 9% of households rented from housing associations and 9% rented from local authorities. In 2016-17 10% rented from housing associations and just 7% from local authorities.
Kate's comments:
The tenure data over the next few years will be interesting. Up until now there is almost ‘horror’ expressed at the fall in home ownership, but for me the real downward trend started at the time of the Credit Crunch: 2007.
At this time, 50% less properties were bought and sold and in October 2008, letting agents were deluged with properties that couldn’t sell they were asked to let. That in itself will have substantially pushed up renting versus home ownership.
Interestingly, when the market started to pick up – 2013 in London and the South, this is when the PRS seems to have taken a little dip.
Now that homeownership has stabilised, we could be looking at the PRS steading too, depending on whether more social homes are built or not and the success of government home ownership schemes such as Help to Buy.
Age: how are different age groups putting roofs over their heads?
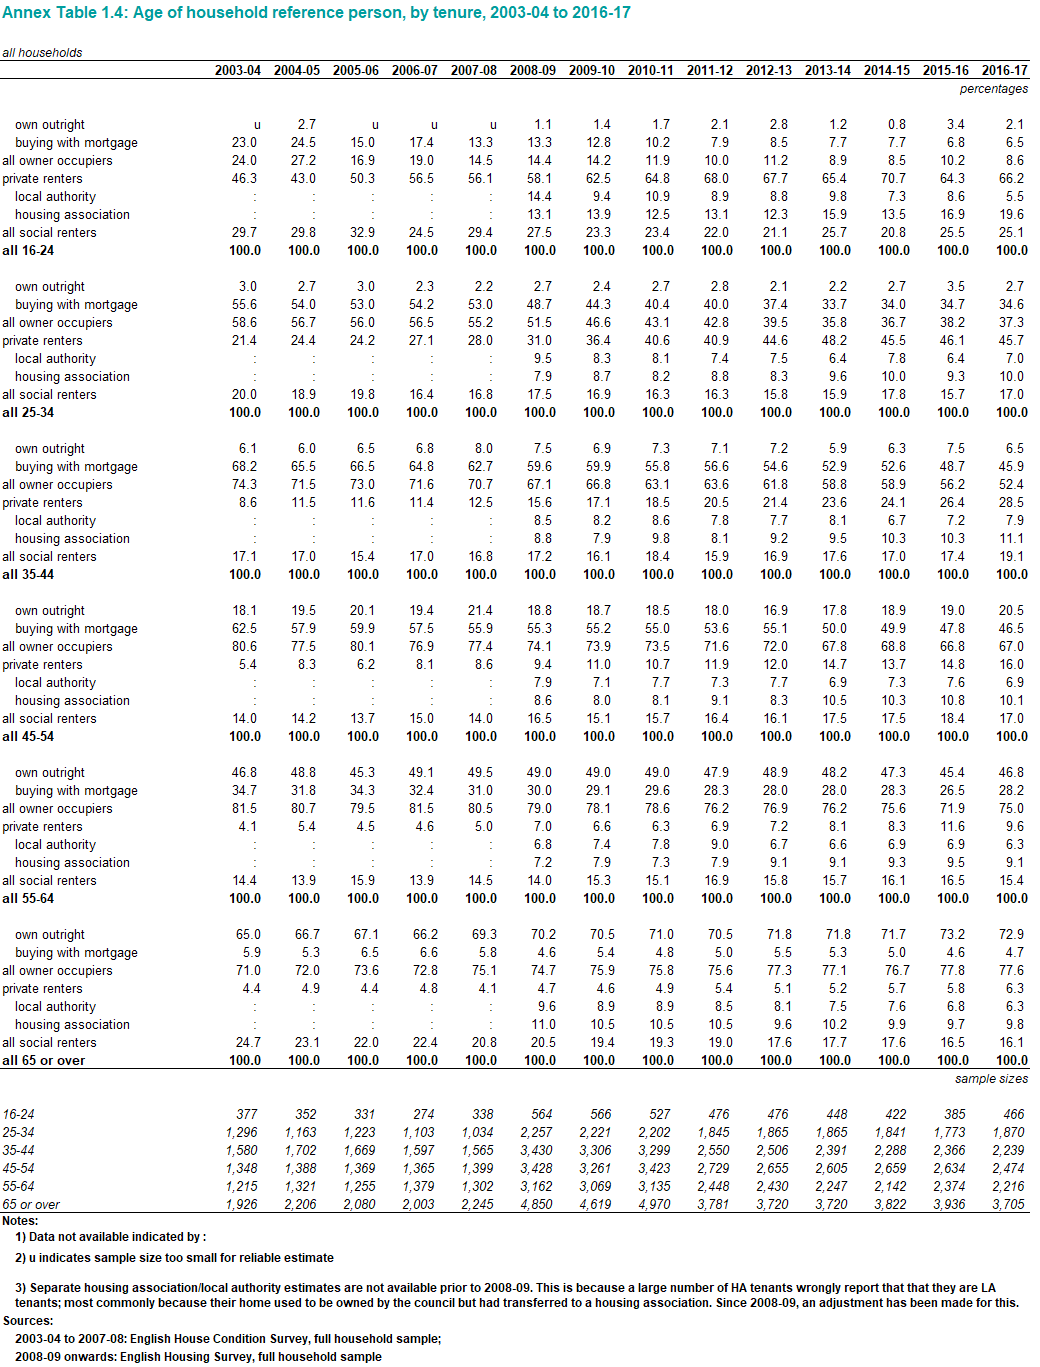
Note: the Household Reference Person (HRP) is the ‘householder’ in whose name the accommodation is owned or rented.
Key points:
More than 60% of outright owners had the main householder older than 65,
60% of mortgaged households had one aged between 34-54
70% of households in the PRS has the main householder younger than 45.
Just under 20% of SRS households were rented by someone aged 16-34, with a similar percentage for the 35-44 and 45-45 age brackets respectively.
The most represented households in the SRS were aged 65 or older.
In 2006-07 72% of 35-44 year olds were owner-occupiers, this dropped to 52% in 2016-17, meanwhile, during this time period PRS numbers rose from 11% to 29%.
57% of those aged 25-34 in 2006-07 were owner-occupiers, this figure for 2017-17 is 37%.
People seem to be staying more in the PRS, increasing over this period from 27% to 46%.
There are some interesting stats this year, which don’t seem to follow previous years patterns. Apart from under 24s and over 44s, there seems to be a small increase in the proportion in social housing, some increases in the PRS in some age groups and a fall in others.
| Buy to let tax - Nicholsons Chartered Accountants | Storing your belongings - Big Yellow | Quick guide to buying and selling - SLC |
 |
 |
 |
