
"The English Housing Survey is a continuous national survey commissioned by the Department for Communities and Local Government (DCLG). It collects information about people’s housing circumstances and the condition and energy efficiency of housing in England."
Below is a summary of the latest reports and a few of my thoughts.
As of 2015-16 there were 22.5 million households in the United Kingdom.
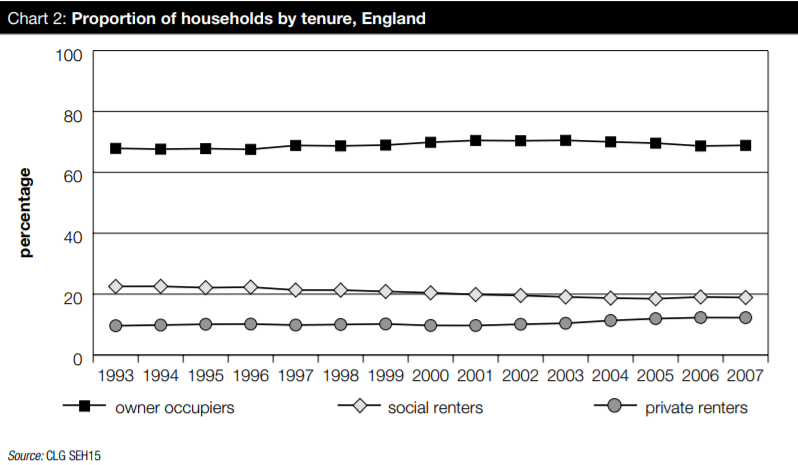
| Year | Owner Occupiers | Social Renters | Private Renters |
| 2015-16 | 63% | 17% | 20% |
| 2014-15 | 64% | 17% | 19% |
| 2013-14 | 64% | 17% | 19% |
| 2012-13 | 65% | 17% | 18% |
| 2011-12 | 65% | 17% | 18% |
| 2010-11 | 66% | 17.5% | 16.5% |
| 2009-10 | 67.4% | 17% | 15.6% |
| 2008-09 | 68% | 18% | 14% |
The figures above and historically suggest a big decline in home ownership; a small decline in social renting and a large rise in renting.
The conclusion many commentators draw from this is that first time buyers are being out priced from the market and this is causing the decline in home ownership. Some even go far as to blame buy to let landlords for out bidding first time buyers and almost ‘stealing’ properties which should have been theirs, forcing them to rent.
I don’t agree with this and my view is until it is widely appreciated that these conclusions are incorrect, it’s highly likely that the ‘housing crisis’ people are so fond of talking about, will continue.
My interpretation of the above statistics is that the main reasons for the fall in home ownership are:
And if affordability was the key cause of a fall in home ownership, then it is unlikely that first time buyers would have fallen by nearly as much in the North East, where prices are still 9% lower than they were in in 2006 as they have in London where they are 40-80% higher (UKHPI data).
Until government, media and housing groups appreciate that affordability plays a role in a fall in home ownership, but is far from the main reason in all areas across the country, then we won’t produce policies such as educating first time buyers on affordability at a local level which will actually help people get on the ladder.
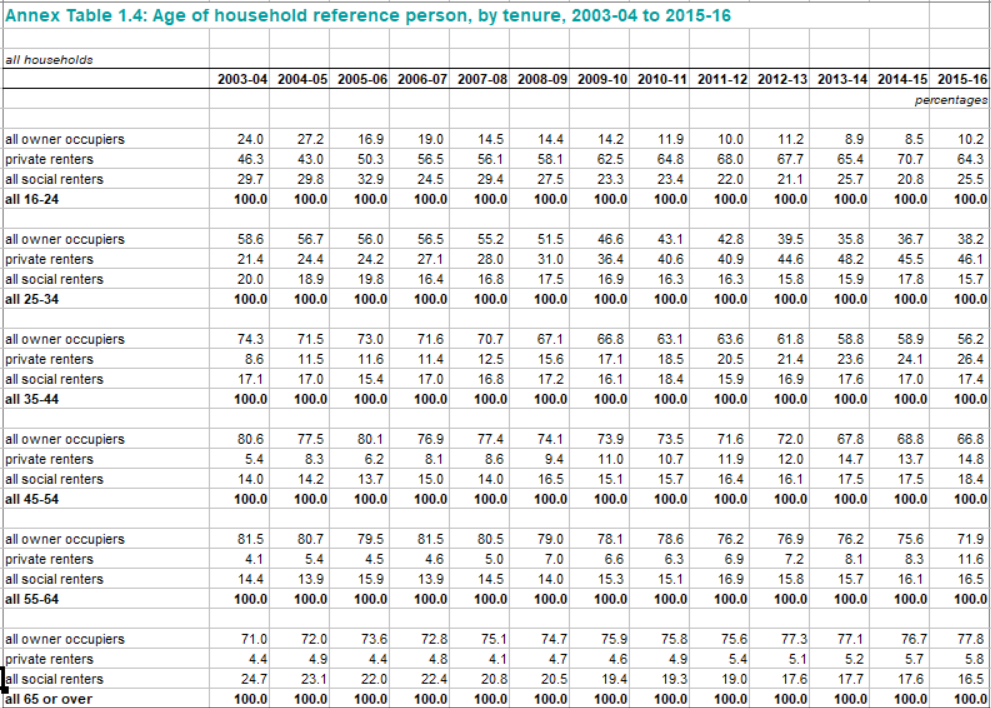
Looking at the data, it’s clear that a higher percentage of people are in the PRS in pretty much all categories, under 65.
16-24 years
The percentage of social renters has dropped from around 30% to 25% and it’s likely the gain has been made purely by the PRS.
The drop in those owner occupied has fallen by more than half, but it’s important to note that this fall mostly seems to have happened after a large rise in ownership in 2004/5, then the credit crunch hit and the percentage has fallen again since then. This ‘switch’ by youngsters certainly makes sense in a market that is falling and it will be interesting to look at how this has changed on a regional basis before concluding it’s an affordability issue.
Other reasons why less people could be buying in this age bracket:
This is especially a figure ‘to watch’ as now that most regions have recovered prices to their 2007/8 heights, it appears the percentage owning it’s just started to increase again.
25-34 years
And in a similar pattern, it’s very clear that the owners in this age group started to really fall, with more people renting up to 2007/8 due to a fall in those renting in the social sector, but the ‘switch’ from owner occupiers really seems to have kicked in when the recession started.
From 2014/15 it appears that renting percentages seem to have stabilised, less are renting in social homes and more are buying.
35-44 years
This seems a relatively stable percentage in the social sector, so a straight switch from buying to renting – likely to be driven by the 50% falls we saw in the number of buyers in during the credit crunch.
As with the younger age groups, it appears the rise in those in the rental sector mirrors the onslaught of the recession and 50% drop in buyers. Although the difference is currently that there has been no increase in the latest ownership stats and renting in this sector seems to continue to be increasing.
55-64 years
This sector seems to have also joined the younger years, with ownership falling from 81% to 72% and the percentage renting actually tripling.
Over 65s
This sector is the only one which has seen an increase in home ownership from 71% to 78% and a substantial fall in those renting in the social sector from 24.7% to 16.5%, while more are renting, the change is minimal.
In conclusion, although more people are renting, we would need to break down the changes to regional level to be able to identify whether this was caused by affordability issues, as often claimed or indeed a lot of the fall in home ownership has been driven by the recession, with more people choosing to rent than to buy.
| Buy to let tax - Nicholsons Chartered Accountants | First-time buyer quick guide - Anthony Pepe | Quick guide to buying and selling - SLC |
 |
 |
 |
