
Each month we take a look at the various monthly and quarterly rental sector reports. Some cover the UK and some cover just England and Wales, with some measuring advertised rents, some new lets and others, existing rents, which is why they might fluctuate.
This is a summary of the report headlines and latest data together with Kate Faulkner’s commentary on the implications for landlords and tenants.
For the full report, read Kate's rental summary
Report headlines
Belvoir Lettings “The average rent for offices across the UK which have traded consistently over the last seven years is £707 per month – an increase of 2.8% year on year. (May 15 – England, Wales & Scotland)”
LSL “Rents driven to new all-time record by divergent south eastern regions. (May 15 – England & Wales, index started in 2009)”
Homelet “In the three months to May, average rental values for new tenancies were 10.7% higher than the same period last year. (May 15 – England, Wales & Scotland)”
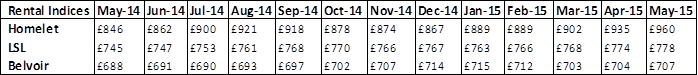
What's happening to average rents nationally?
Kate Faulkner's comments:
“The rental changes can be misleading, so it is worth understanding how rent rises work in the PRS. There are typically three different types of rent rises. Firstly, rental changes from landlords who rent to existing tenants. This is typically close to zero and why the likes of LSL and Belvoir tend to show lower rates of inflation than Homelet. The next increase is those properties which were let to existing tenants and are now ‘new to the market’, these tend to have a higher inflation, and finally, there are brand new properties coming into the PRS via developers and also those that have been newly renovated. It’s the latter inflation that Homelet tends to pick up, hence their rates are a lot higher than the likes of LSL, Belvoir, Countrywide and ONS.”
For the full report, read Kate's rental summary
What's happening to rents at a regional level?
LSL “Annual rent rises in London, the East of England and the South East deviate significantly from the rest of England & Wales. On an annual basis, rents rose by 13.0% in the East of England. This is the largest annual rise seen in any region since records began in 2008. London comes in second with a 7.4% annual increase in rents, followed by the South East, where rents grew by 3.6% year-on-year. By contrast, rental growth in the other regions of the UK was relatively subdued. The next largest increase was in Yorkshire with more modest 1.6% annual rent rises, followed by the South West with 1.4%, and annual rent rises of just 0.9% in both the West Midlands and the North West. In three regions rents are actually lower than a year ago, led by Wales with a 2.8% fall in average rents since May 2014. Rents in the East Midlands are down by 0.8% while in the North East rents have fallen 0.4% annually. (May 15)”
Homelet “All regions saw an increase in average rental values in the three months to May, compared to last year. For the first time in six months, Wales has seen an increase in average rental values, compared to last year. Greater London, South East, South West, East Anglia, West Midlands, Yorkshire & Humberside and East Midlands have seen continuing increase in rental values over the last 10 months. (May 15)”
HSBC “Property investors are looking north, as the top three cities with the best rental returns are Manchester, Kingston upon Hull and Blackpool. Last year’s top spot, Southampton, dropped to sixth place after a decrease of 18.30% in rental yield. Annual rents in Manchester have risen 4% from £8,316 in 2014 to £8,628. It has one of the largest student populations in Europe; and more than a quarter of housing stock is privately rented (26.85%), the largest proportion of all locations. Both Kingston upon Hull and Blackpool have entered the top three for the first time thanks to low average property prices and strong rental demand. With typical house prices of £69,135 and £79,654 respectively, Hull and Blackpool require the lowest initial investment of all locations researched.
“Year-on-year growth in rental yield is 38.7% in Forest Heath, Suffolk, where the average house price increased from £158,925 in 2014 to £171,322. Average annual rents rose 49% over the same period. Typical annual rents in Forest Heath have increased from £8,316 to £12,432: a rise of £4,116. Thanet has the second-greatest yield increase of 19.70%, while Hastings (7.90%) is in third place. Tower Hamlets is the only London location in the top BTL Hotspots for annual yield growth. The area covers much of the redeveloped Docklands area including Canary Wharf, and is the only London area that has seen positive growth in average rental yields (1.20%). Annual rents in this area have increased by 18% or £3,072, just outpacing a 16% rise in house prices over the same period (from 414,461 to 481,745). (May 15)”
For the full report, read Kate's rental summary
Kate's comments on regional rental variations:
“The rental market is clearly starting to mirror the house price market, in that rises are starting to be common place around the UK. However, they are not increasing at the same rate, nor do the increases last as long. Wages are a clear ‘natural cap’ on rental prices. Basically, people are securing money from the ‘bank of mum and dad’ to help them with a deposit for a house, but little help tends to come from parents for those moving into the rental market. In areas where demand is not outstripping supply, we are seeing rents not rising, even to cover inflation, meaning landlords there are effectively getting a pay cut in real terms. So it’s a mixed picture regionally, making it difficult for government to pursue policies such as ‘rent controls’ on a national basis.”
For FREE, independent and up to date advice on Buying, Selling, Buy to Let or Renting a Property, sign up for FREE to Propertychecklists. Join now to access our FREE property checklists, including:-
