
Kate's property price update
National prices
Despite a fear of the property market slowing dramatically and even going into a slight ‘reverse’ gear, in these early days the figures and feedback from indices and agents do seem to continue to be positive, even if growth is weaker. Rightmove suggest that properties are coming onto the market at the “smallest price rise at this time of year since February 2009”, up just 2%, and warn both sellers and agents to price fairly, suggesting that properties are “40% more likely to sell if priced right when they first come to market” and, in their experience, “buyers [are] reluctant to enquire if property is priced just a few percent too high”. And so far this year it looks like Nationwide’s suggestion of a 2% increase in property prices for 2017 seems plausible if activity continues as it has started this year, especially as we have yet to really dive in to see the potential impact, if any, of the Brexit vote on confidence and the economy. LSL Acadata HPI reminds us though that “we will need to wait until April 2017 before the changes associated with the introduction of the stamp duty surcharge drop out of the annual statistics, and the rate of annual house price growth better reflects the underlying trends in house prices that currently appear to be prevalent.”
For more, see our data on the various national price reports.
Regional prices
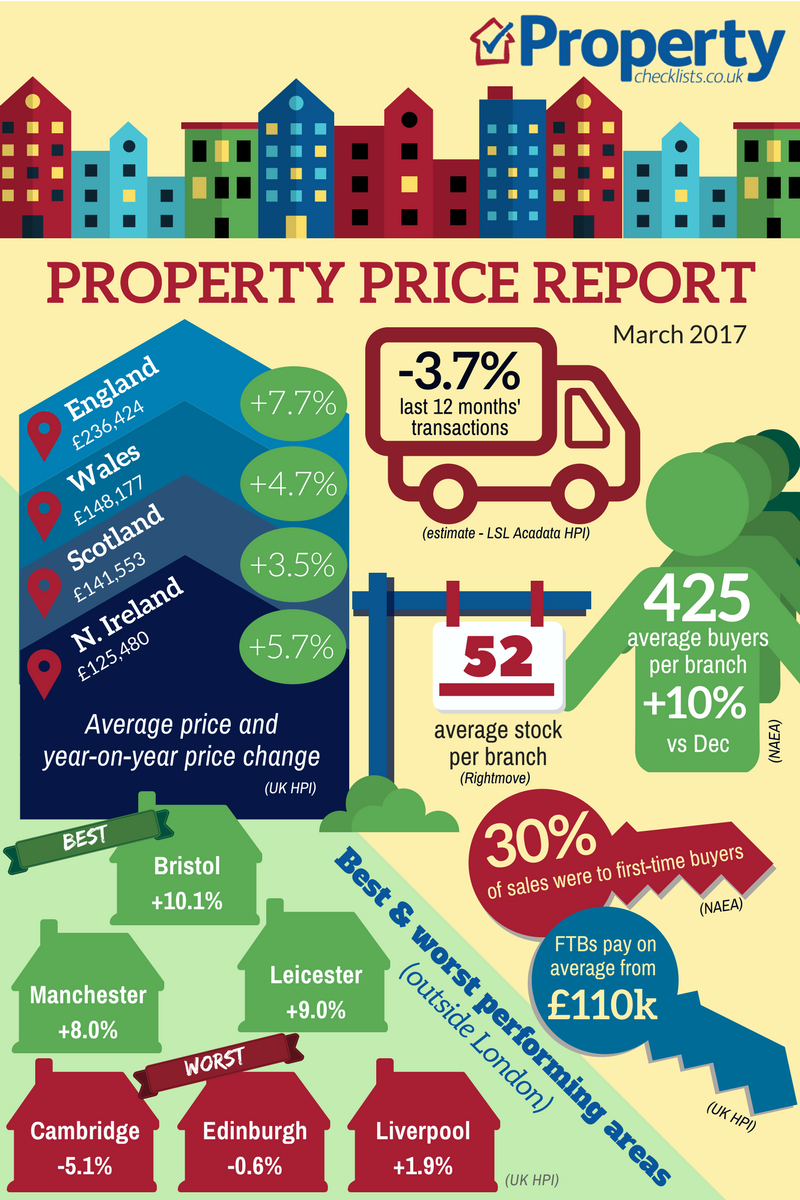
Source: UK HPI
Prices in England continue to forge ahead – on average. However, we need to all better understand the role of cash in property transactions and how inflation impacts on property values, especially from an investor’s perspective. Taking the 21% increase in property prices in England since the height of the market, this may on the surface look a healthy growth. But when you take into consideration that inflation, ie the cost of living, has gone up by 27% since then, it’s actually not great news at all as the 50%+ of people who own property with cash have potentially seen a real fall in what their property will actually purchase should they cash it in. This situation then gets better or worse depending on where and when you bought. If you bought near or at the height of the market before the crash, areas such as Northern Ireland and Scotland still haven’t recovered to their peak nearly 10 years ago now, although it looks like Wales may achieve this, this year.
For more, see our comprehensive regional and city data.
Break the data down to regions and the picture for cash investors /owners of property looks much worse; only three out of our nine regions manage to exceed inflation. Most areas don’t beat inflation at all, including the North East and North West which are basically seeing prices stay the same as they were nearly 10 years ago.
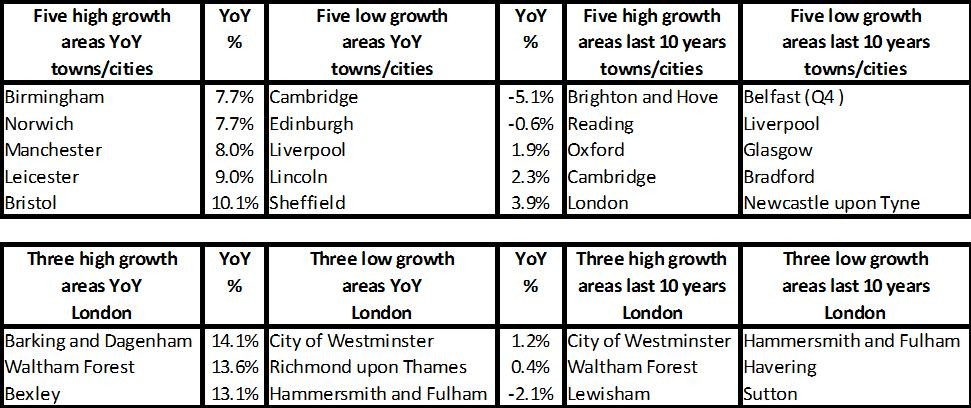
According to Hometrack’s City Index, “The growth in city house prices since 2009 has been highly varied ranging from 13% to 85%. There remains material upside for house prices in large regional cities outside London” – showing the huge divergence in property price growth not just regionally, but by town and with the area, by postcode.
With changes to buy-to-let taxation, it’s important that anyone investing in property long term with cash has an analysis to work out whether they would be better off re-mortgaging, even a little, to see if they could secure greater returns on their investments, rather than the current capital losses.
Need some buy-to-let help? Read our BTL quick guide.
Nationwide look into cash purchases and their impact on the market further. Their current data shows that in 2005, cash purchases accounted for just 20% of transactions, this grew to a peak of 38% in Q1 2016 – prior to the stamp duty hike. Currently the South West sees the highest level of cash purchases (a big area for second homes) at near 45% while Scotland has the lowest at just over 30%.
The question remains moving forward, post April and even the summer stats, will the regions outside of London and the South see double-digit growth that we’ve seen in the past or are we now truly into an era of low priced growth?
Supply and demand
It is scary that despite the current government doing what it considers it can to provide more stock for sale, the RICS is continuing to record “the average stock per surveyor just shy of a record low”.
Need to sell sharpish? Read our how to sell quickly guide.
While supply remains constrained, this will continue to drive the market forward from a price perspective as long as people have the money to spend. This in turn will see prices continue to rise.
For more on property prices, download my comprehensive update.
