Rightmove “2018: A tale of different markets leads to Rightmove forecast of +1%”
NAEA Propertymark “Homebuyers bag a bargain as a record number of sales go through at less than asking price”
RICS “House prices remain broadly flat at the national level”
Nationwide “House prices rise by a modest 2.6% in 2017”
Halifax “2017 house price growth eased to 2.7%”
LSL Acadata HPI “First monthly increase in house prices in England and Wales since March”
Hometrack “City HPI projected to be +5% over 2018”

For more on property prices, download my comprehensive update.
In the past the media would have been going crazy with these kind of headlines, even though they clearly state more of a slowdown rather than a crash. However, ‘property crash’ headlines would be rife which always made a slow market much worse – as buyers would hold off for prices to fall. However, we are into days of more accurate reporting, partly thanks to better commentary from the industry. Last year, from memory, there was just one main Daily Mail ‘expos’ about a crash but it was exaggerated and the rest of the media quickly squashed the idea.
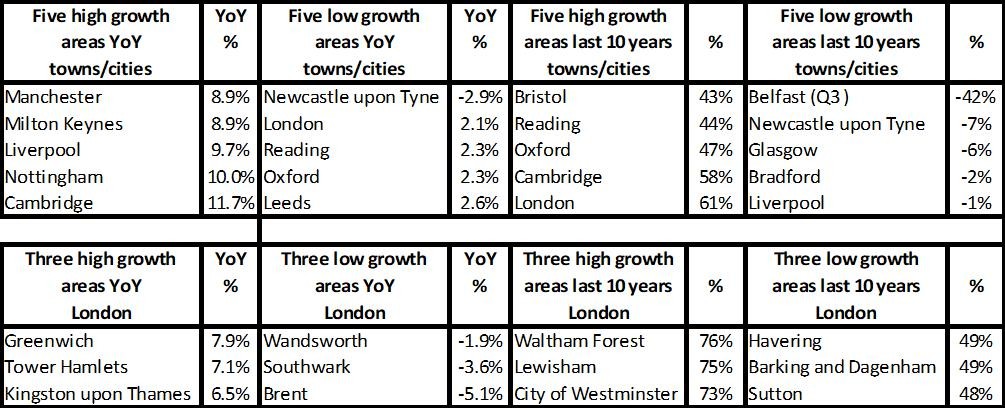
This is good news for the industry, but we are still not producing good enough data in my opinion either for the media or for consumers on what’s happening in the local area. For example, I was on BBC Radio Nottingham recently when they were very excited about Nottingham ‘topping the charts’ of price growth. Without commentary about the fact that this means prices are merely back to where they were 10 years ago, many sellers would have expected a huge increase in value year on year. Yet I showed three examples: properties which had risen by more; ones which hadn’t changed and ones which had fallen.
What this means is that although these reports on ‘average’ property prices are useful from understanding what’s happening in general, if you are buying, selling or investing, then you have to know the micro market for that particular property on the specific road you are buying.
That means looking at sold property price data first, then talking to agents and then deciding whether the property is a good deal or not and having that confirmed by a professional valuer.
For more, see our data on the various national price reports.


Source: UK HPI
The figures this month really show how property price growth is slowing substantially versus previous growth. For example, since 2007, the price growth in England was 24%. This is lower over a 10-year period than the ANNUAL price growth achieved in 2003 alone. With annual house price growth now settling in single figures, way below the annual average since 2000, agents and developers will need to think about how to persuade people it’s still worth the cost of moving when many sellers may not have additional equity to pay for it. Without thinking through how to manage this future dilemma, the market could completely grind to a halt with a lack of movers. Schemes such as Help to Buy could come into their own here – as could Shared Ownership in more expensive areas.
It also means renting is likely to become more of a sensible financial as well as personal choice. One area to start looking at to see the potential impact is the North East where population growth (ie demand) is fairly flat, prices are still 9% lower than they were (on average) 10 years ago and annual price growth is running at a third of its annual average increase since 2000. Interestingly, despite property being such great value, according to Nationwide figures, the fall in the percentage of first-time buyers from 2006 to 2016 was the second biggest next to London. If this trend spreads throughout the rest of the UK, the number of buyers and sellers are both likely to fall and we could see one of the most stagnant markets ever.
The only thing that might change this is the possibility of landlords selling off poor returning properties or ones they want to now cash in on following their first new tax bill with mortgage interest relief cut.
For more on property prices, download my comprehensive update.

Source: UK HPI
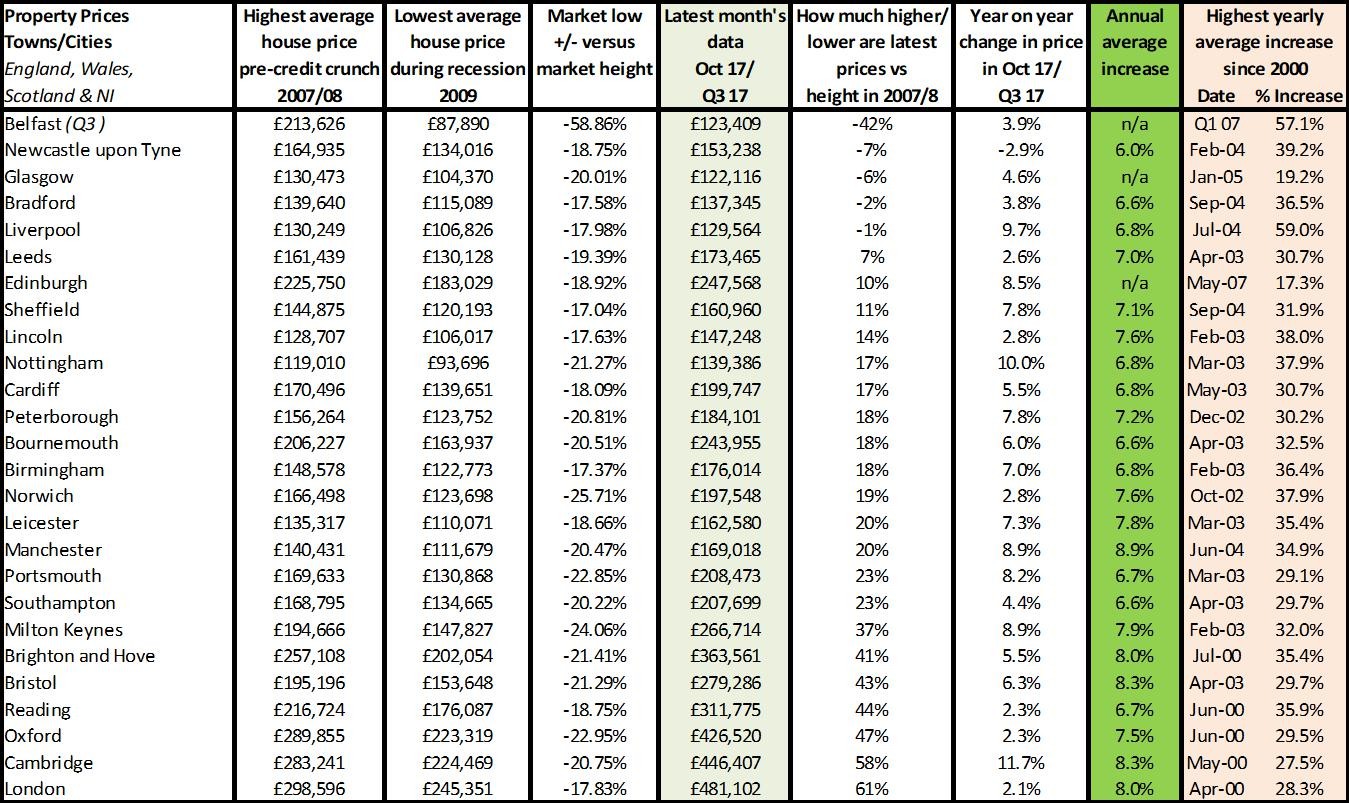
It’s astonishing that we still have five towns – Belfast, Newcastle, Glasgow, Bradford and Liverpool – which, according to UK HPI figures, have house prices at lower levels than they were 10 years ago. I don’t think I have seen any areas take this long to recover from a house price recession. Comparing this recession’s market recovery with the 1990s recession, I found that it took seven years this time around versus eight in the 1990s for property prices to recover to their previous height in England – and carry on growing, while Wales took 10 years this time versus eight years in the last recession. Regionally, London was super quick, taking just four years versus seven in the 1990s, while most regions took seven-eight years in both recessions, although not all areas had data available.
From a town perspective, the main comparison is that some cities/towns – such as Reading, Oxford and Cambridge – took just four-six years to recover from 2007, while areas such as Belfast (Q3); Newcastle upon Tyne; Glasgow; Bradford; Liverpool have yet to recover 10 years on. Compare this to what happened after the last recession, when these areas were seeing phenomenal growth in just one year (see last column); for example Belfast at 57%; Liverpool at 59%, while Newcastle saw growth of 39%, Glasgow at 19% and Bradford at 36.5%, whereas current forecasts suggest regions will struggle to grow in line with average inflation rates of 3%.
What’s clear to date is that the house price growth we are used to seeing post recession has only so far affected London and some of the Home Counties. Overall, capital growth is clearly slowing.

For more, see our comprehensive regional and city data.

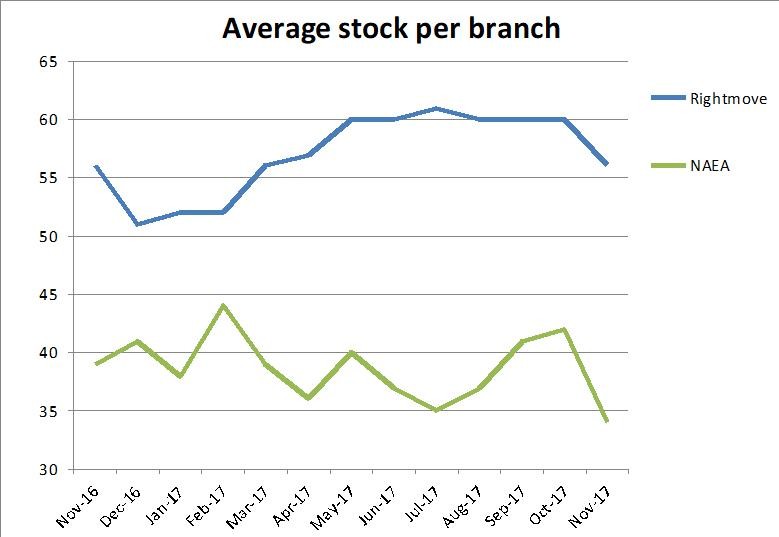
Demand looks like it is slipping along with stock levels so in areas where stock remains tight versus demand, prices may ease, but still see increases. On the other hand, some areas or property types may experience falls where demand slips below supply. In some areas where we are carrying out individual property analysis, such as the likes of Essex, we are finding properties in normally popular areas which have been on the market for several years; typically unheard of pre-credit crunch or in the post-credit crunch boom.
What’s critical is ensuring that you know your individual property market and don’t try to make decisions based on what the media and ‘averages’ are telling you – if you do that, you are likely to be making the wrong ones.
| Buy to let tax - Nicholsons Chartered Accountants | Storing your belongings - Big Yellow | Quick guide to buying and selling - SLC |
 |
 |
 |