
.png)
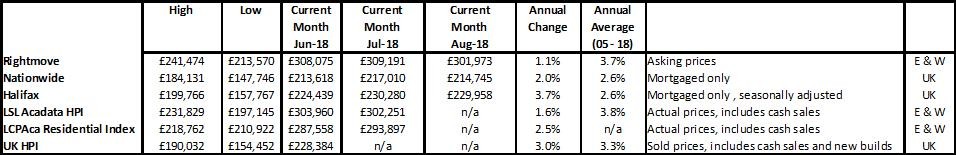
Rightmove “Home-movers need to act now to move by Christmas”
NAEA Propertymark “First-time buyers reap the rewards of a slow summer”
RICS “Sales market remains broadly flat at headline level”
Nationwide “Slowing in annual house price growth in August”
Halifax “Annual house price growth rises to 3.7% in august”
LSL Acadata HPI “Average house price in England and Wales now £302,251”
LCPAca Residential Index “Annual prices remain static whilst transactions continue to fall”
Hometrack “UK city house price inflation moderates to 4.2% year on year ranging from +7.5% to -4.0%”
For more on property prices, download my comprehensive update.
Between 2000 and 2018, average property prices have increased each year by 6-10% depending on the area. However, since 2005, even before the credit crunch, property price growth had started to slow in many areas across the country, reducing average annual property price growth to around 3% from 2005 to today. These are half the levels people have been used to. In 2018, prices were always expected to slow, following rapid growth in the south and east of the country, with prices hitting new affordability buffers due to a tightening of lending criteria, and coupled with reduced demand from buy-to-let investors.
For more, see our data on the various national price reports.
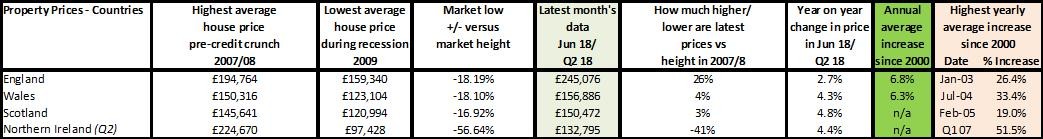
Source: UK HPI
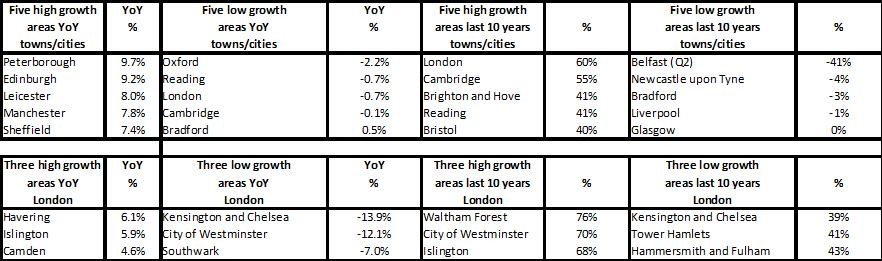
The country differences across the UK remain vast over the last 10 years and even year on year. Average price changes over the last 10 years range from -42% in Northern Ireland (even though prices are up 4.4% YoY) to 28% up in England, although this is mostly driven by London (up 60%), the South East (38%) and the East of England (up 39%, mostly due to the success of Cambridge).
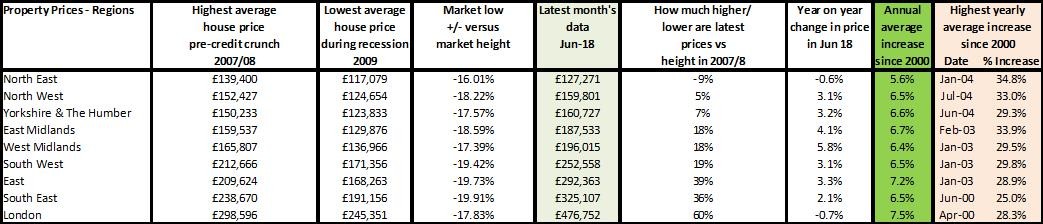
Regionally, variations still remain enormous, running from prices being down -9% over the last 10 years in North East versus 60% growth for London – despite recent falls. Interestingly, both areas are seeing year-on-year falls of just under 1%.
Within the regions there are even bigger ‘doldrums’. For example, in London a recent report from Savills (Q2 2018) shows a 17% fall in prices since a 2014 peak in Prime Central London, through to a 6.6% fall in Prime North and East London. Overall, all Prime London has fallen by 10.6%.
Source: UK HPI
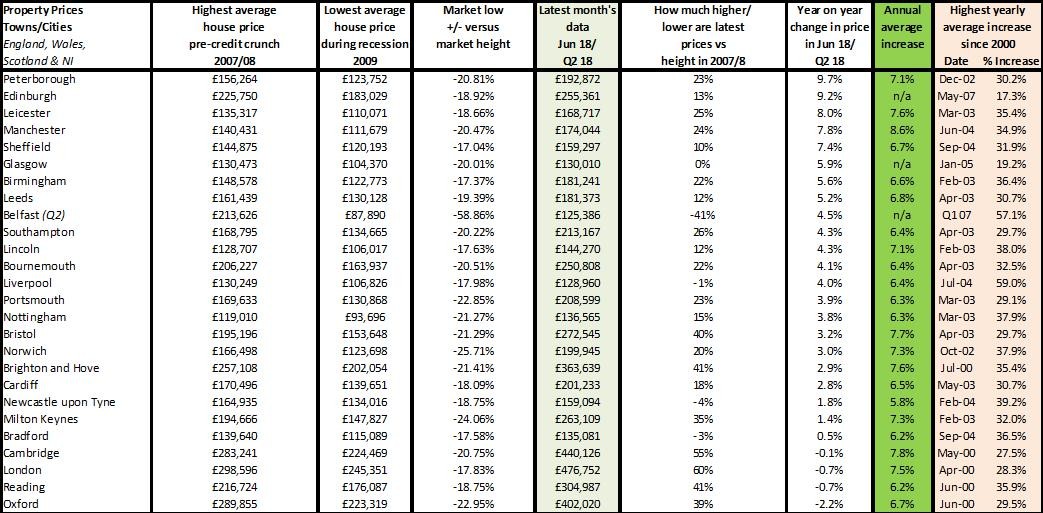
Edinburgh, Peterborough and Leicester are topping the year-on-year property price charts this month, with above-average long-term annual growth of 8% or more. It’s interesting that this shows almost no pattern at all, when prices in the past have typically rippled out from London to the Home Counties, then to the regions. Manchester is also performing well and is, by all accounts, currently an extremely busy market, but interestingly the annual growth is still below the long-term growth and, over the last 10 years, prices have failed to keep up with inflation (24% growth vs 31% inflation). Considering many investors are moving ‘up north’, chasing better returns than the South appears to be able to deliver, those who are used to investing in cash need to think twice as, if price growth doesn’t improve, it could mean buying an asset that appears to be growing in value, but in real terms could actually be making a loss – especially taking into account higher taxation.
Source: UK HPI
For more, see our comprehensive regional and city data.
Transactions, supply and demand
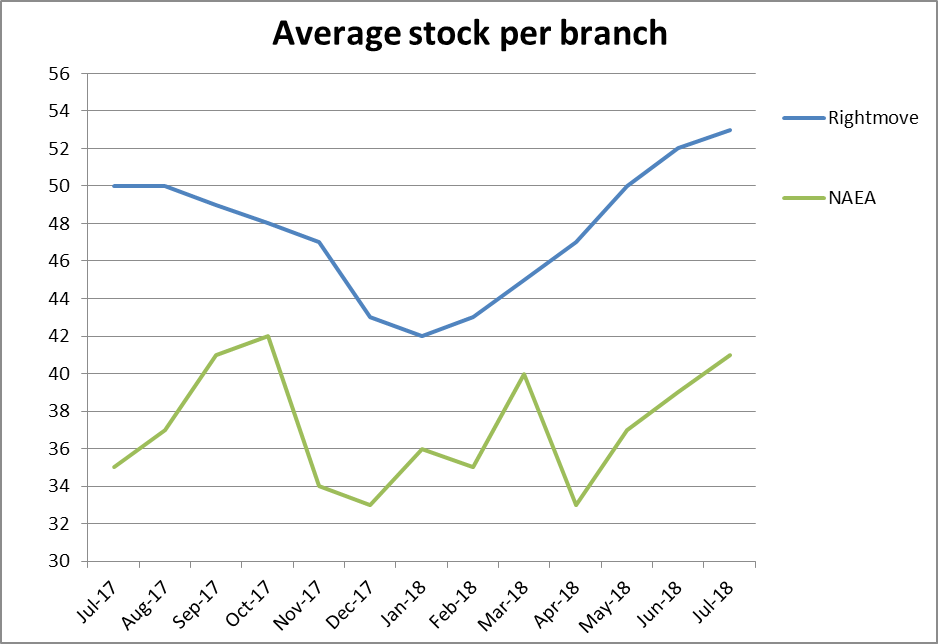
Transaction changes will be critical over the coming months to see what will happen to the market moving forward - across the country. Currently, all the trends seem to suggest the market will tighten. This, coupled with the uncertainty of Brexit and the squeeze on wages, is likely to exacerbate the current reports on the number of agents who are going to struggle into the future.
| Buy to let tax - Nicholsons Chartered Accountants | Storing your belongings - Big Yellow | Quick guide to buying and selling - SLC |
 |
 |
 |
