
.png)
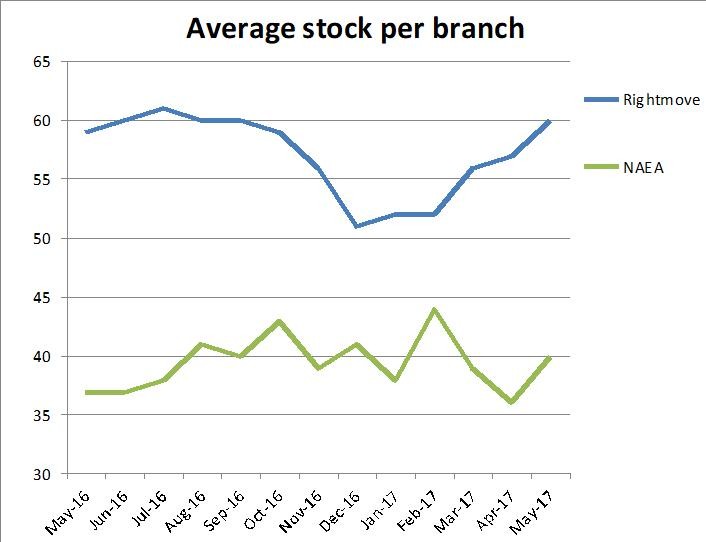
Rightmove “Sales still strong, but prices fall in June for first time since 2009”
NAEA Propertymark “Only three per cent of properties being sold above asking price”
RICS “Activity metrics continue to deteriorate”
Nationwide “House price growth regains momentum in June”
Halifax “Annual house price growth eases to 2.6%”
LSL Acadata HPI “A new north-south divide as northern regions drive transactions”
Hometrack “Annual rate of growth increases to 4.7%”
National prices
It’s clear from all the indices and the latest media ‘chatter’ on house prices about to fall off a cliff, that property prices continue, in the main, to slow. Rightmove’s lead indicator on how sellers are feeling suggests that asking prices have reduced for the first time since 2009, although there is a ray of light coming from Nationwide and Hometrack, suggesting a slight uptick this month.
For more on property prices, download my comprehensive update.
In reality, what we are seeing is a natural slowdown from the recovery in the South and East, while in the rest of the UK prices have done well in the last few years, albeit not as robust as their southern and eastern counterparts. Moving forward, it’s likely that in particular, the mortgage indices will see some falls with the new stringent affordability tests moving from 3% above base to 3% above a lender’s SVR.
For more, see our data on the various national price reports.
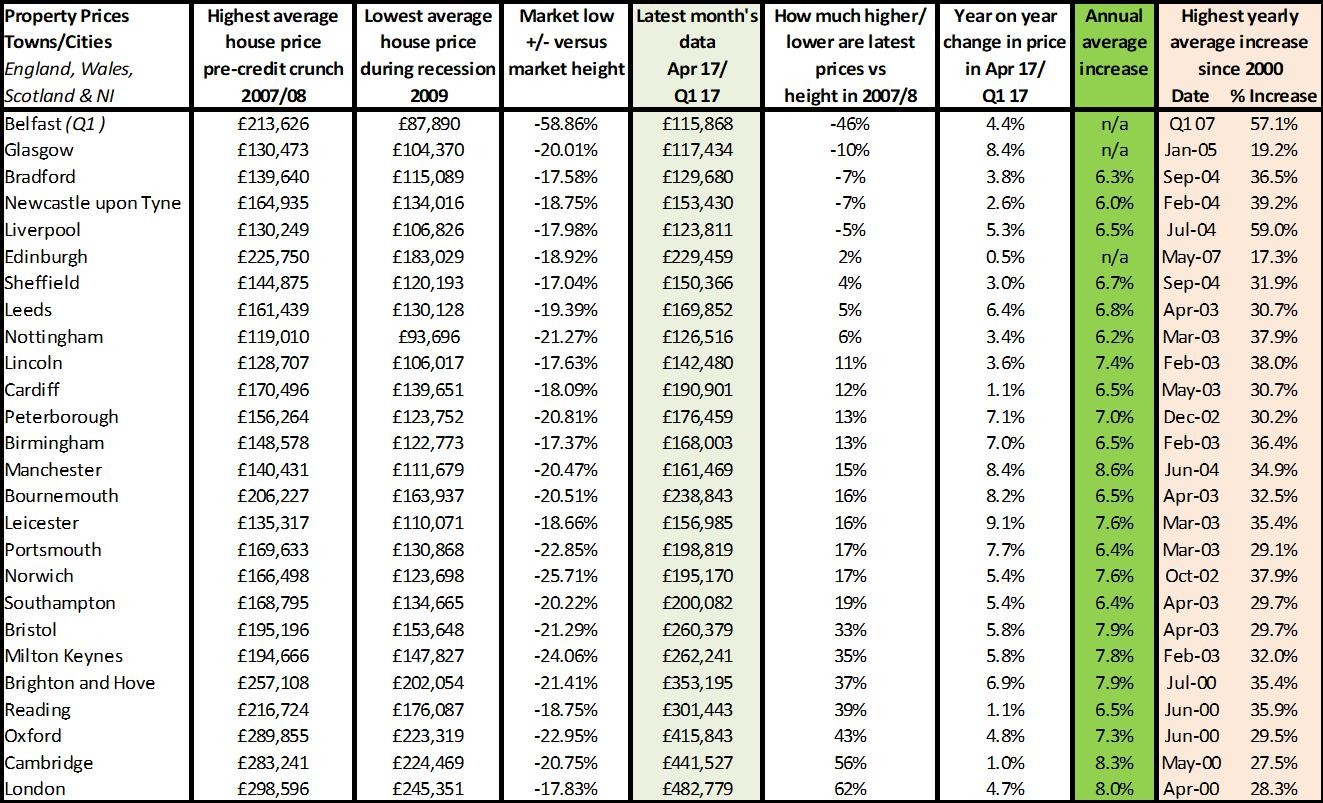
Source: UK HPI
Scotland, with Wales not far behind, are on average, seeing the first signs of positive growth since the highs of 2007/8 which were swiftly followed by dramatic falls. This is good news for both countries, albeit may be short lived if the ‘bad property market news’ and uncertainty around Brexit continues. Add to this the higher affordability requirements, and this may cause further stagnation, making it difficult for second and third steppers to move with the lack of equity growth. Regionally, for the first time since the recovery, we are seeing year on year performance for all areas, bar the East, being below its long term average – including London, which is running at nearly half its normal growth levels.
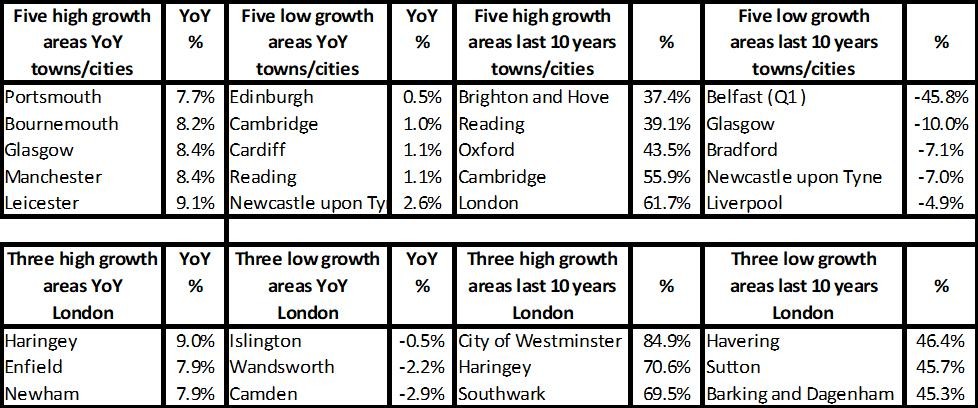
However, Hometrack state this month that “the annual growth rate in London (3.3%) is at the lowest for 5 years, but with signs of ‘bottoming out’. We do not expect the London City index to go negative year on year in 2017.” Other indicators suggest though that the East, especially Cambridge has now topped out so it will soon dip below its annual average growth rate too. This is mainly due to previous amazing price performers such as Islington, Wandsworth and Camden recording price falls, while other areas such as Newham and Enfield continue to do well year on year. Haringey is the exception though, remaining one of the highest growth areas year on year, and still keeping the title of one of the top price earners over the last 10 years.
It’s interesting to see from the Hometrack index that although some cities such as Nottingham and Manchester are seeing some good growth, this is nothing like the levels seen in the South/London and such rapid rises are unlikely to be able to be supported while the economy falters and uncertainty reigns – and of course the media go back to digging up their knowledge of property crash reports!
For more, see our comprehensive regional and city data.
A crash only tends to occur when demand plummets in comparison to supply. In areas where supply is plentiful and economic performance is poor/OK, we aren’t seeing huge house price increases. In London, although demand has fallen, a crash so far has been avoided as there is still a demand versus supply issue in many areas, which is putting a ‘floor’ on the level prices can fall.
For more on property prices, download my comprehensive update.
Key checklist: Quick guide to buying and selling legals.
