Rightmove “Prices hit record highs in first-time and second-stepper sectors”
NAEA Propertymark “First time buyer stamp duty relief starts to make an impact – but more help is needed”
RICS “Demand backdrop deteriorates further”
Nationwide “Annual house price growth remained subdued in March”
Halifax “Annual house price growth at 2.7%”
LSL Acadata HPI “Regional peaks while London slowdown persists”
LCPAca Residential Index “Whilst average prices for new builds reach 12.5 times earnings, the market as a whole begins to falter”
Hometrack “UK city house price inflation running at 5.2%”

For more on property prices, download my comprehensive update.
The national market movements continue to hide the huge variety of changes to property prices at a regional level but also between the indices. Looking at the average annual change since 2005, the last 12 years show that on an annual basis, property prices have grown by an average of 2.5% through to 3.7%, while current annual property prices are up between -0.7% (LSL) through to 4.6% (UKHPI). But overall it looks like we might be lucky to see a 2% rise this year.
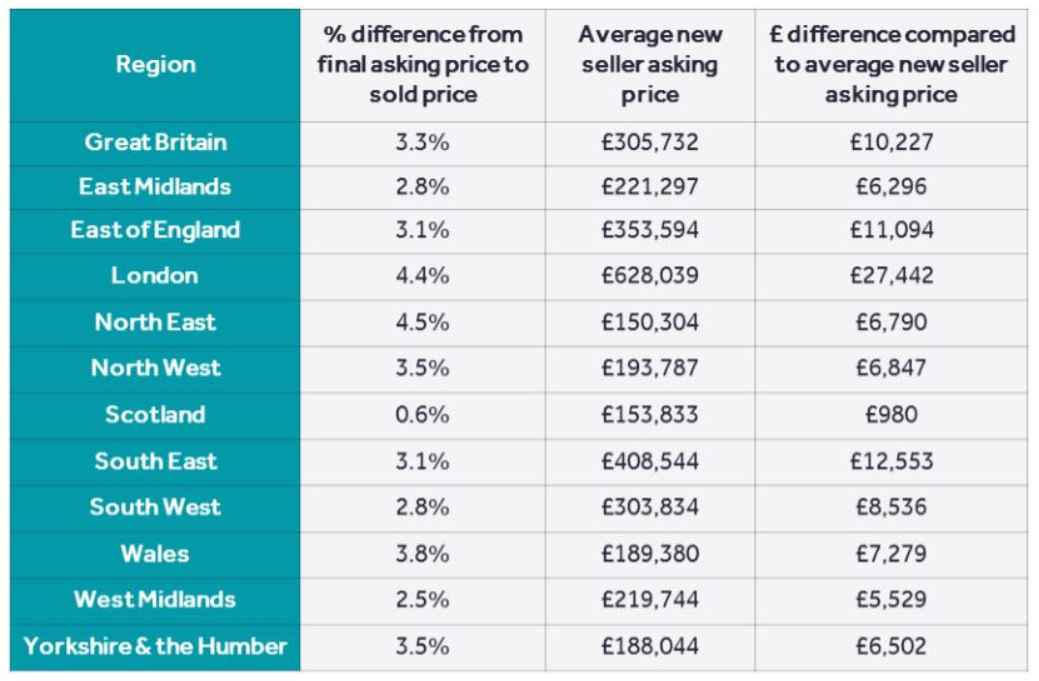
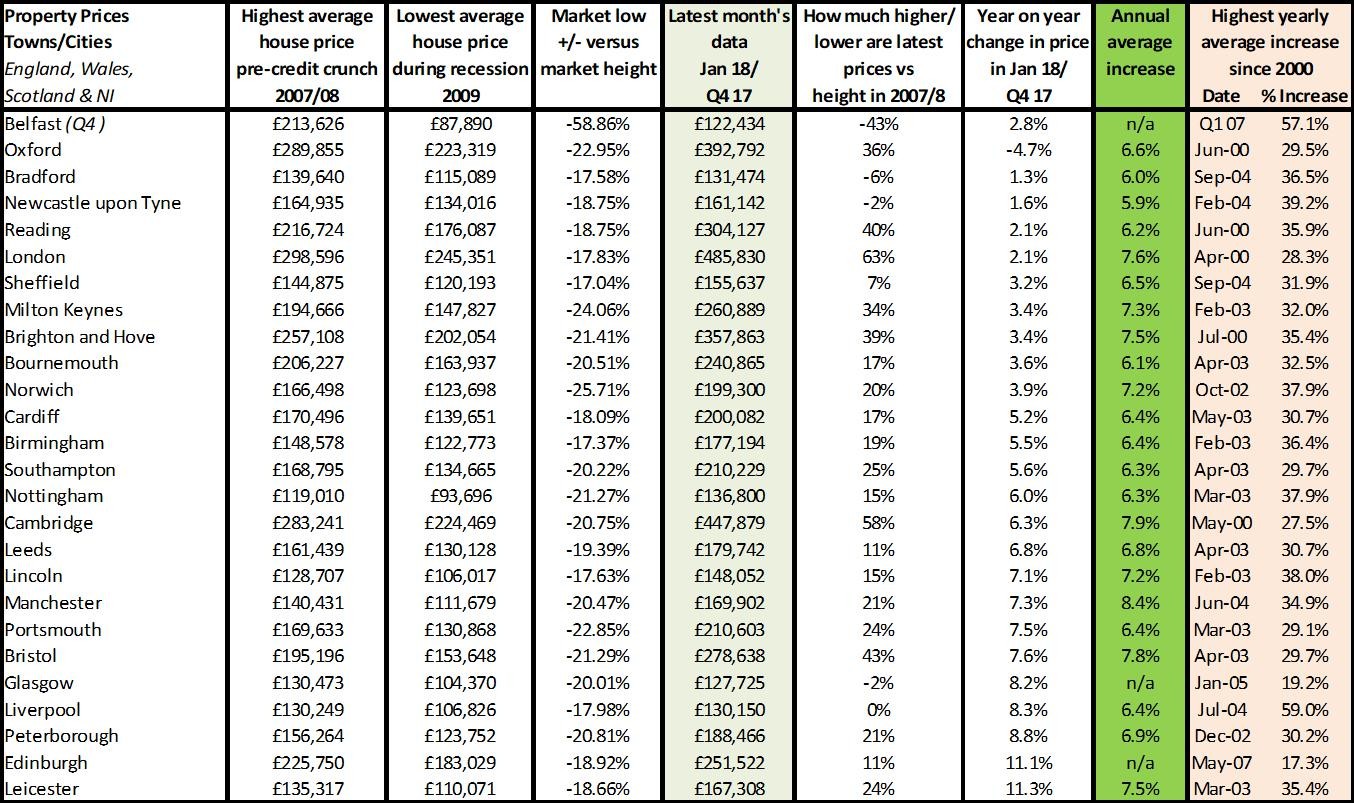
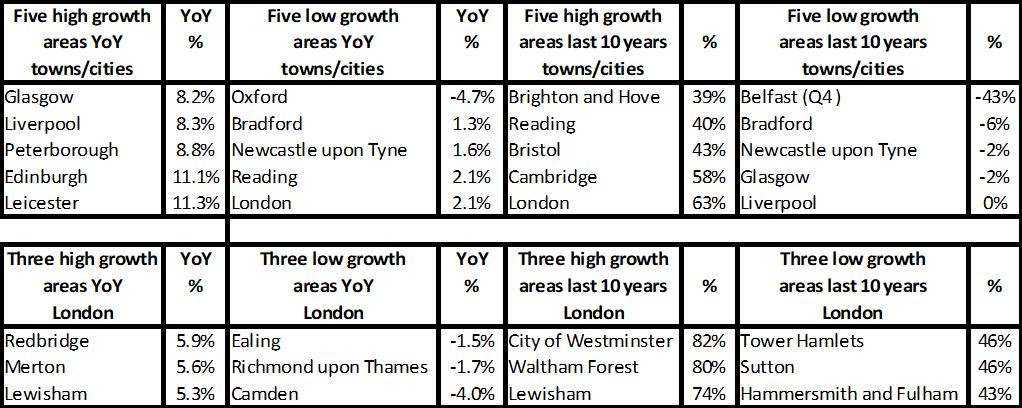
Rightmove’s latest data on the percentage of offers achieved versus asking prices shows that, regionally, Scotland is performing best with offers coming in at just 0.6% below asking while London – with its current struggling market – is achieving a much lower offer rate of 4.4%, near the North East’s figure of 4.5%. Meanwhile on a city basis, Hometrack’s results show that Aberdeen property prices continue to fall through the floor -7.7% year on year, while the top performers are Liverpool at 7.8% and ‘nearby’ Edinburgh at 8%. That’s a huge difference in performance and shows how the main drivers of house price performance currently appear to be local economic conditions as opposed to national conditions.

For more, see our data on the various national price reports.

Source: UK HPI
We are in such a weird situation when it comes to country differences. Scotland is topping the charts with a 7% rise year on year, while prices are still only 2% higher than they were 10 years ago. Wales and N.Ireland are similar in that they are growing by 4.5% and 4.3% year on year. But the performance difference versus 10 years ago is stark – Wales just 2% up over the last decade, while N.Ireland is still struggling to get anywhere near previous prices – being 42% down. There is often talk of the ‘property bubble bursting’ but I think it’s fair to say that, for many homeowners in N.Ireland, it already has and, at rates of 4% annual growth, it’s hard to see if prices there will ever recover.
For more on property prices, download my comprehensive update.


Source: UK HPI
From a regional perspective, Nationwide point out that the slowdowns in London, the South East and East Anglia – which have seen 60% rises since the crash – have now ‘overshot’ and prices are starting to fall. Meanwhile as the Midlands and most areas in the North and Scotland are doing well price growth-wise, we are seeing a “narrowing” of the North and South divide, which is likely to continue over the next few years.
The big regional news story is really the struggling London market which, as you can see from the Hometrack chart, shows “42% of postcodes are registering year on year price falls. The remaining 58% are still registering positive growth.” So it’s not all doom and gloom for those who live in the boroughs still growing or who have been in this market for more than a few years. However, for those who finally got onto the ladder in the last couple of years at the new market peak, there isn’t much good news in that Hometrack continue to believe prices will “drift lower” for the next 2-3 years. From an investor or even FTB basis, there may be some bargains to be had over the coming months/years.
It’s clear that the ‘ripple effect’ of house prices rising in the South and then this growth spreading out to the regions still exists, although in my view this has become muted. The next question we need to answer is: if prices haven’t ‘taken off’ at anything like the rate they have down south, will the current halt to house price rises (and, in some areas, reversal) which we have seen in London be replicated elsewhere? For example, even in areas such as Wales, Scotland, Yorkshire and Humber and the North West/East which have hardly had time to recover from the previous market crash?

Source: UK HPI
For more, see our comprehensive regional and city data.
Transactions, supply and demand

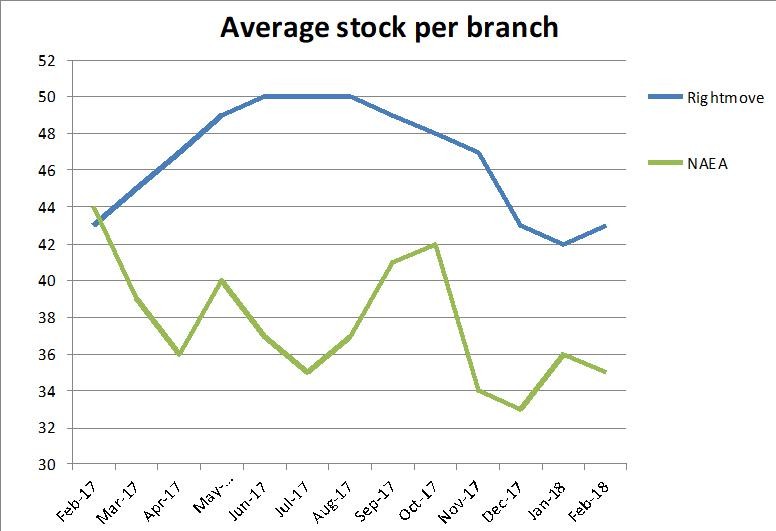
Transaction data is a little scary just now. Basically we have so few sellers that if a buyer can find a property, it may be their market, but if a buyer or tenant can’t find a property, they tend to stay put, meaning less property turnover – bad news for the industry and economy, but also for the public. A market where few people move when we are so short of newly built homes is a disaster economically. For anyone thinking of moving, it’s still well worth giving it a go, even if it means popping notes through doors or pounding on the door of agents to let them know what you want or need.
| Buy to let tax - Nicholsons Chartered Accountants | Storing your belongings - Big Yellow | Quick guide to buying and selling - SLC |
 |
 |
 |