
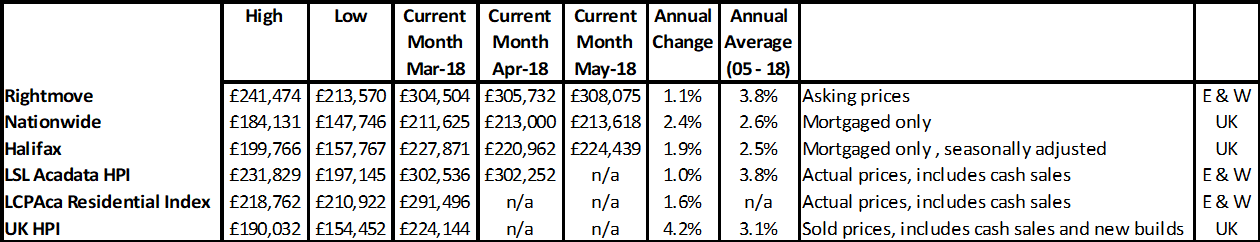
Rightmove “Prices hit all-time high but number of sales agreed down 5% on 2017”
NAEA Propertymark “Housing market swings back in the favour of sellers”
Nationwide “Modest slowing in annual house price growth during May”
Halifax “Annual house price growth softens to 1.9% in May”
LSL Acadata HPI “Prices in Wales surge 4.8% as buyers rush to beat new Land Transaction Tax”
LCPAca Residential Index "England & Wales continues to show a disappointing performance”
Hometrack “UK city house price inflation 4.9% year on year compared to 6.9% per annum over the last 5 years”
For more on property prices, download my comprehensive update.
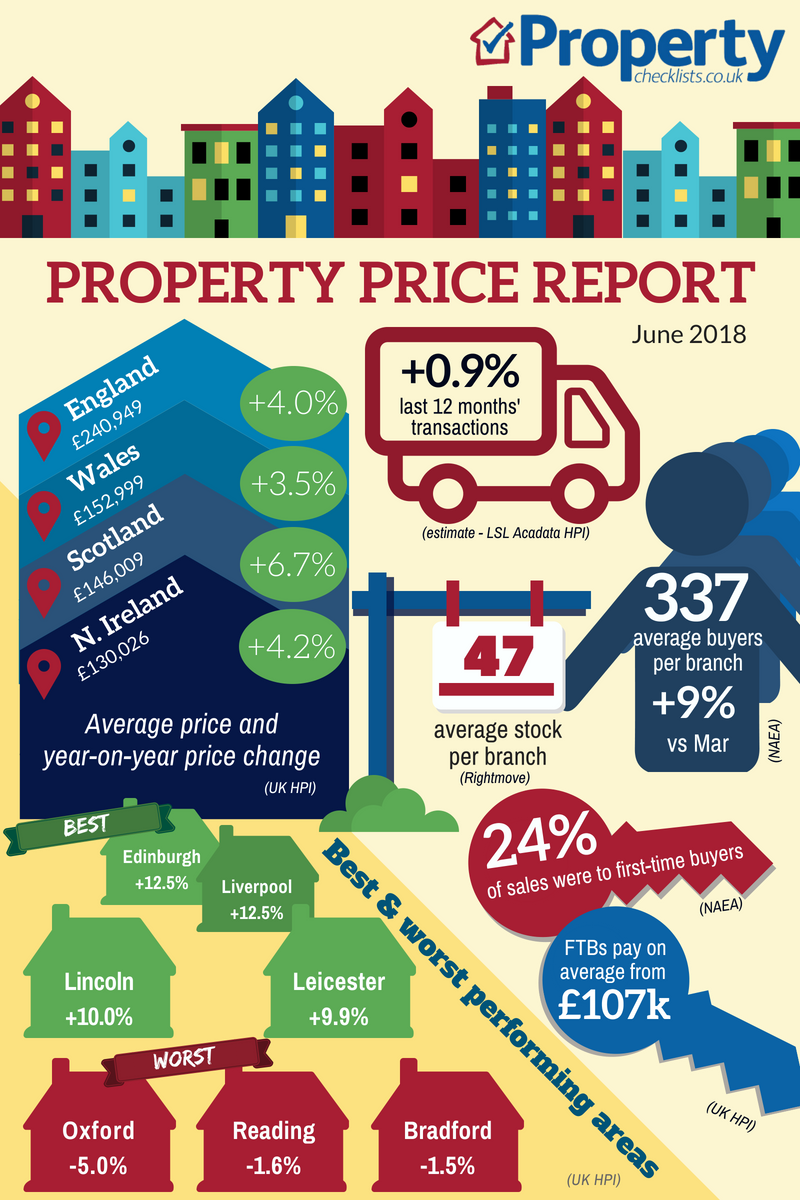
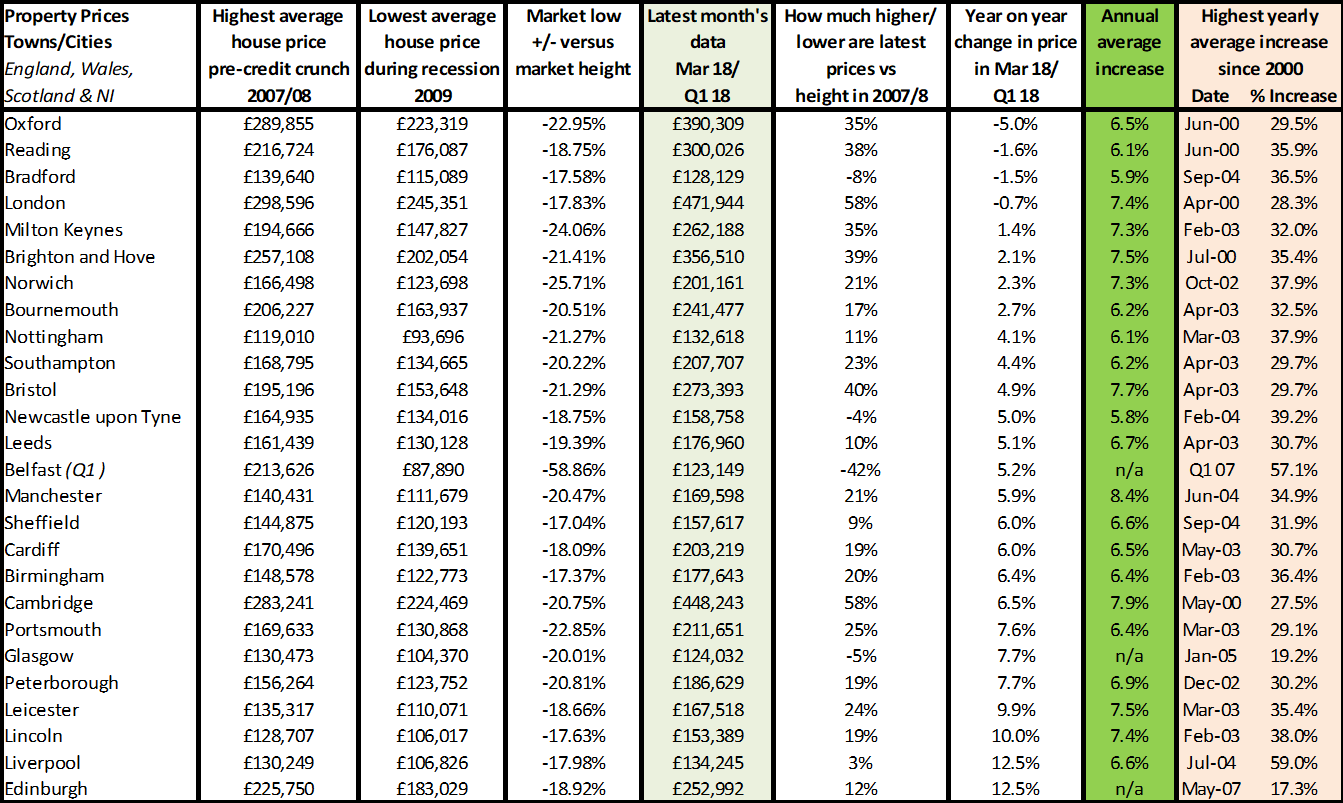
As we go through the year, the annual change versus 2017 for all the indices is falling, although the Land Registry figures are lagging behind everyone else. This time last year we were reporting growth from 2017 vs 16 of between 2% and 4.4%, while today average rises in prices are only just keeping ahead with growth mostly of around 1-2%.
However, according to LSL Acadata, this is mostly driven by poor performance in the capital: “Compared to London, the housing market in the rest of England and Wales looks robust. About three quarters of all unitary authorities (80 out of 108) have recorded a price rise over the last year.”
Overall, we have a market where people are still buying and selling property, albeit at a slower rate. This is backed by a recent article in the Sunday Times which reports figures from sales progression experts View My Chain, suggesting the average chain remains three properties long, but sales are taking longer, up to an average of 105 to 115 days.
For more, see our data on the various national price reports.
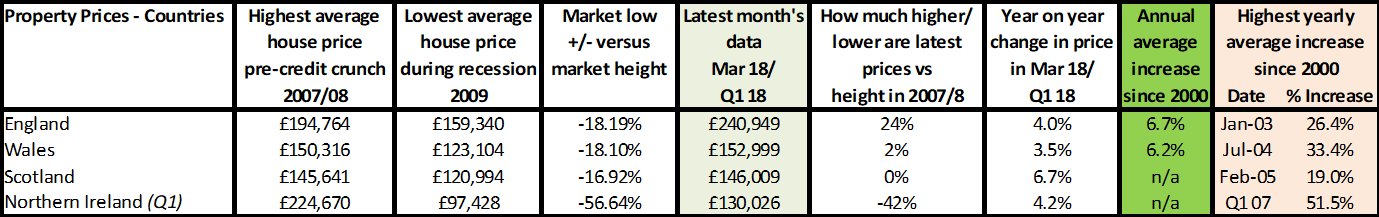
Source: UK HPI
Country-wise, Scotland appears to be booming – although this doesn’t include Aberdeen. Wales is hitting the headlines this month where, according to LSL, prices have increased by 4.8% annually. However, this is not natural growth, but government forced to avoid the rise in the new Land Transaction Tax seen in April. As a result though, “six of the eight most expensive local authority areas in Wales set a new peak price in March, including Monmouthshire, the Vale of Glamorgan, Cardiff, Powys and Newport.” Unfortunately for Wales though, this growth is expected to slip back fairly sharpish and, with only just over 2% growth in the last 10 years, it’s surprising this area isn’t thriving more.
For more on property prices, download my comprehensive update.
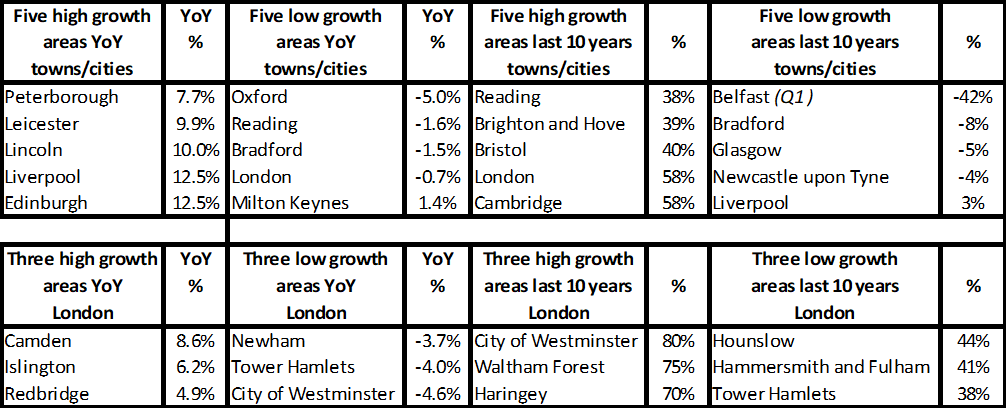
From a city perspective, Hometrack are pointing towards Bristol as one of the top performing cities over the last five years, growing at a rate of nearly 9%, while the new ‘northern property price power house’ of Manchester tops this year’s price rises, growing at 7.7%, but still not achieving the double-digit growth seen in the Home Counties and London.
Where next for capital growth? Hometrack’s view is that the likes of Manchester will continue to perform well, coupled with Birmingham, Leicester, Nottingham, Cardiff, Sheffield and Edinburgh. However, with news reports creeping into the media about slower price growth and increasing ‘uncertainty’ in the economy, and more reports of job cuts and problems on the high street, I think there is a chance capital growth will pull back in many places by the autumn. Please feel free to hope or predict I am wrong though!
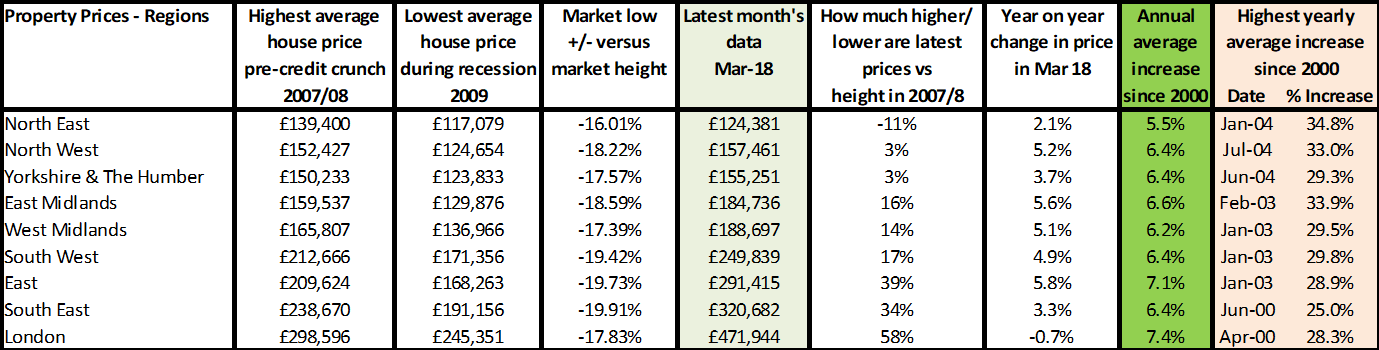
Source: UK HPI
With inflation rising at approximately 27% over the last 10 years, out of the 26 towns and cities we track via the Land Registry, only 30% (eight) have seen average property price growth in excess. According to the Nationwide’s long-running price index, which goes back to the 80s, property typically rises 2.8% above inflation each year, so this means for the last decade it’s not kept pace at all. Looking at forecasts from the likes of Savills and Knight Frank, they are unlikely to do so into the future either.
Aberdeen has the largest discount to asking prices and is possibly one of the toughest areas to sell at the moment, proving how localised markets are. According to Hometrack, buyers are taking advantage of the situation, offering “the largest discounts (9.6%)” due to the “shock on the back of a lower oil price”. Not only are people selling at a discount, but prices have fallen a further 7.2% versus last year, meaning they are moving completely in the opposite direction to everywhere else, registering a “19% [fall] since the end of 2014”.
However, just like national statistics mask what’s happening regionally, so do regional and town/city numbers mask what’s happening at individual property level. Those who know their area well enough to spot individual demand and supply changes for different property types should continue to do well moving forward as they are more likely to be able to take on properties at a realistic price which will continue to sell, even though the market is, in general, likely to slow.
Source: UK HPI
For more, see our comprehensive regional and city data.
Transactions, supply and demand
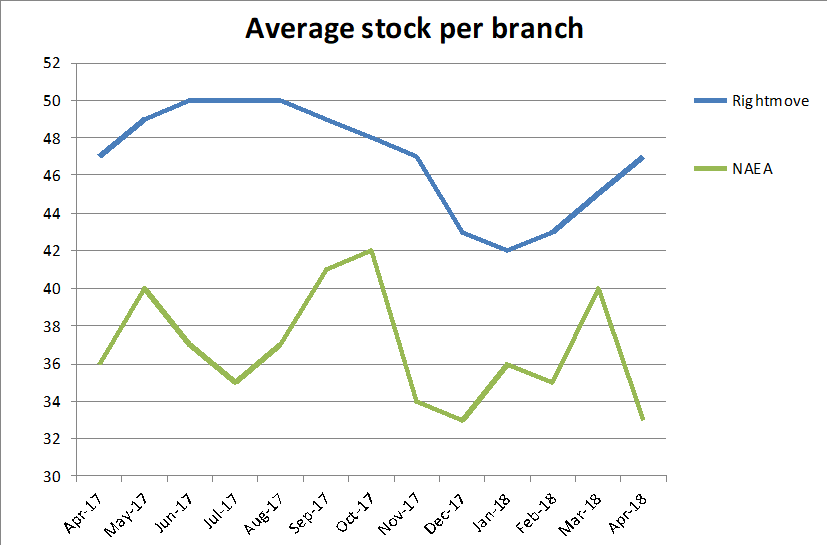
According to the NAEA, stock has fallen for branches while the Rightmove data is showing a small increase. With regards to what’s happening regionally, LSL Acadata conclude that Q1 18 vs 17 shows that the areas experiencing falling sales are those that have seen high price growth and are now struggling with demand due to affordability issues. The five areas which continue to see volumes hold steady include the North West, Yorkshire and Humber, West Midlands and Wales, all of which have good levels of affordability. The only area which doesn’t fit this scenario is the North East, suggesting there are different issues influencing the lack of growth in this market.
| Buy to let tax - Nicholsons Chartered Accountants | Storing your belongings - Big Yellow | Quick guide to buying and selling - SLC |
 |
 |
 |
