
It looks like being a quieter year for the property market in 2017 but, considering the last 10 years have seen credit crunch price falls followed by rapid rises in some areas, a more stable market should be welcomed by all.
Nationally, this month’s price reports cover three trends:
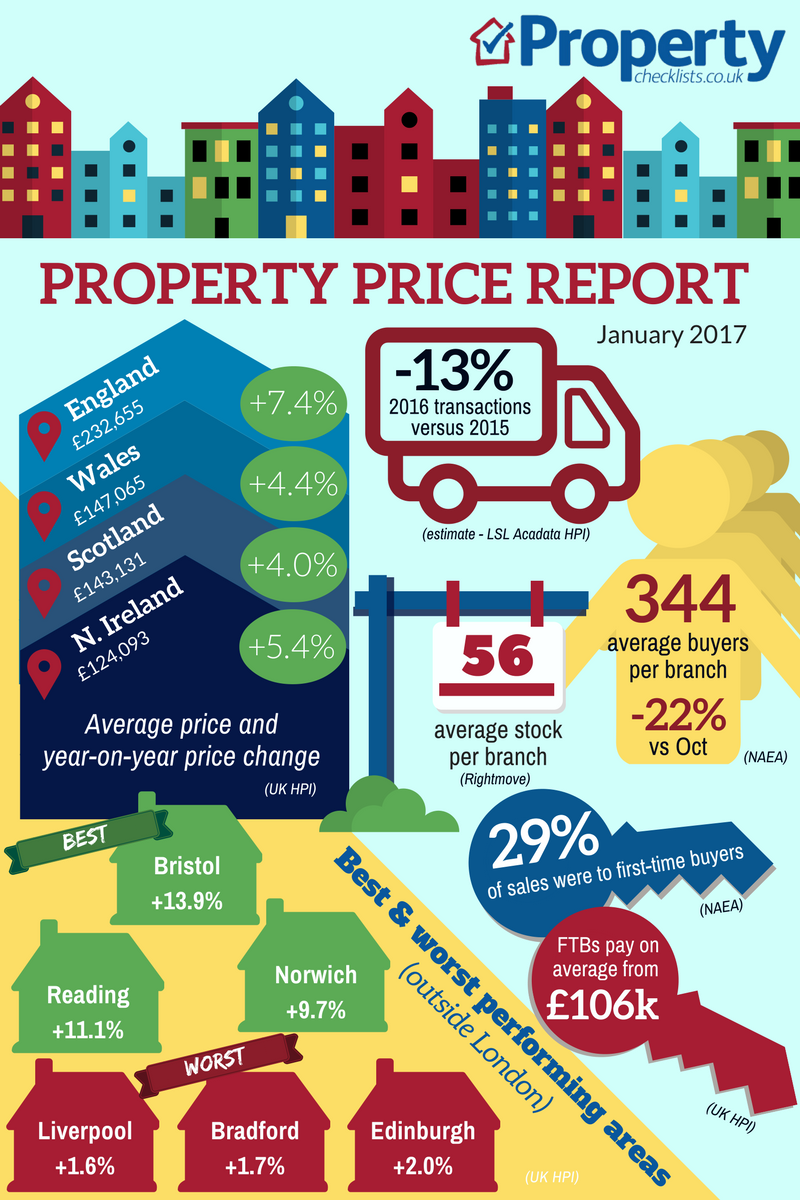
How 2016 fared compared to 2015
Halifax say prices are up 6.5% year on year, while Nationwide data shows prices rose at the same rate of 4.5% in 2016 as they did in 2015, showing a steadier property price market than seen since the credit crunch.
According to LSL, “December saw some of the strongest monthly growth since the beginning of the year, however annual growth slowed slightly to 3.1% in December from 3.5% in November”.
The year ended with prices (excluding London and the South East) up 4.4% year on year.
For more, see our data on the various national price reports.
Mortgage finance
Mortgage lending remains positive with both the Bank of England and the BBA showing an increase in house purchases towards the end of the year versus the annual average, and net mortgage borrowing up 2.4% versus a year ago.
Transactions, demand versus supply
Overall, we have seen property transactions fall while prices have risen due to stock shortages. Quarterly property transactions are down year on year, but the picture remains artificial as they are still feeling the effects of activity burst in the first quarter of 2016, when investors rushed to beat the stamp duty hike in April. If we look at the whole of 2016, they are down by just 3.9% on 2015 and 4.4% versus 2014.
The supply issue remains with a shortage of property stock in most areas, but RICS reports that this remains “broadly unchanged” from October, with an increase in instructions in some areas offsetting drops in others, so as ever, the picture is very regional and individual to the property market you are buying and selling in.
Looking to buy for the first time in 2017? Read our FTB quick guide.
Demand for property fell in November, according to the NAEA, who recorded: “an average of 344 house hunters registered per branch in November, a decrease of 22% from 440 in October, which is in line with seasonal expectations”.
But the RICS survey shows demand actually increased in November… with 13% more surveyors reporting a rise in new buyer enquiries rather than a fall, and that enquiries increased in most parts of the UK.
Overall this appears good news for the latter part of the year as, according to RICS, “The increase in demand led to a further rise in agreed sales with a net balance of 9% of contributors reporting growth over the month. While this is the highest reading since February, it is still indicative of a very moderate rise in activity.”
From a supply perspective, both Rightmove and NAEA showed that average property stock per branch took a, perhaps normal, end-of-year downturn. Meanwhile the supply of new build property shows no real growth year on year, with private registrations up by just 3% and registration for affordable homes up by 14% according to the NHBC, who said: “We saw strong numbers across the majority of the country throughout the month as we approach the end of the year.”
Asking prices versus sale prices
According to the NAEA, 84% of properties sold for less than their asking prices in November, which means sellers would be wise to be more realistic about pricing their properties if they really want to secure a buyer.
Need to sell sharpish? Read our how to sell quickly guide.
Property price predictions
For a full review of the property price forecasts for 2017, read our forecast report. For now Rightmove predict a 2% increase in prices, while Hometrack believe City house price growth will slow from the current 7.7% rise year on year to 4%.
Which property price performance does your property buying or selling scenario fit into?
Regionally, Hometrack provides the most useful analysis this month, breaking down the performance of markets into three distinct types:
“Accelerating cities”
These include London, Oxford, Cambridge, Bournemouth and Bristol, which have all seen solid price growth over the last five years but are now slowing due to affordability issues.
In these cities, agents need to consider promoting Help to Buy, Shared Ownership and areas which can still be considered ‘good value’ or commutable to the city centres. For example, Peterborough has easy access to Cambridge.
For more, see our comprehensive regional and city data.
“Strong, steady growth”
These cities – which include Birmingham, Manchester, Leeds, Leicester, Nottingham and Portsmouth – show good growth but still have affordable areas and properties.
However, it’s important for investors to know that although these areas may be affordable and offer reasonable rental returns, they may not see the level of house price growth achieved in the “accelerating cities” and all have areas where property price growth has been virtually non-existent over the last 10 years. In some cases, especially city centre flats, prices fell dramatically during the credit crunch and are yet to recover.
“Falling cities”
Finally, there are the “Falling cities”, although Hometrack are only tracking one of these; Aberdeen which, due to issues with oil prices, has experienced year on year price falls of -6.4% per annum.
This shows the importance of the local economy on house prices, and how it now has a greater influence than national ‘national’ movements.
Find out what’s happening in your local area with our UK HPI regional report and our summary of the property price surveys including Rightmove, Your Move, Reeds Rains, Nationwide and RICS.
Kate’s summary of the property price reports and what we should look for next
The question for 2017 is whether areas in the North and countries such as Wales and N. Ireland will ever see any of the double-digit growth experienced in London and the South over the coming years, or if property price growth is finally slowing down and will match economic and income growth for the first time since the millennium.
For more on the data we analyse, read Kate's guide to the property indices.
