
From an economic, property and political perspective, 2016 will be a key year in understanding if – and how – our property market has changed since the credit crunch.
One way to work out how the property market is currently performing is to compare the falls and recovery of this property recession with the time it took to recover from the last recession in the 1990s.
We can do this on mortgaged properties (ie not including cash sales) thanks to some of my favourite data from Nationwide: their ‘house prices adjusted for inflation data’.
Real house price falls and recovery
During the recession of the 1990s, we saw property prices fall – in real terms, ie taking into account inflation – from the second quarter of 1989 when a height of £140,833 for mortgaged properties was achieved (source: Nationwide) and it took until first quarter of 2002 for them to recover to £142,554. That’s 13 years. The biggest fall from the market height to low was to £88,211, a fall of 37.4%
So far, during the credit crunch which started to hit in 2007/8, the height achieved for mortgage average prices was in the third quarter of 2007, at £231,141. In quarter four 2015 prices have only recovered, in real terms, to £197,044, so we still aren’t there yet. But, taking into account how long it took to recover after the last recession, we are “only” nine years into recovery and therefore may need another four years to get back to 2007 levels, when taking inflation into account.
In comparison, the biggest fall in average prices during this time was to £171,343. At a drop of 26%, this was a smaller drop than the 1990s recession, which is surprising considering how much worse this recession was supposed to have been.
Nominal house price falls and recovery
Looking at nominal prices in comparison, Nationwide data shows that average prices peaked at £62,782 in quarter three 1989 and fell to a low of £50,930 during the recession. That’s a fall of 19% from the height to the lowest point. It then took until the first quarter of 1998 to recover to an average price of £62,903.
In comparison, during the millennium recession, we saw nominal prices drop from £184,131 in quarter three of 2007 to a low of £149,709 in quarter one, 2009. This time around it took until quarter two 2014 for prices to recover to their previous heights: £186,544. Under this measure, the falls in this recession were pretty much the same as the last one as they fell by 18.7%.
Real and nominal recession comparison for mortgaged property prices
In summary, comparing the 1990s recession to the recent one, it looks like we are actually doing better. Prices fell by less in real terms and, when looking at nominal prices, they have recovered faster too.
| 1990s Recession | 2007 Credit Crunch | Difference | |
| Nominal Price Falls | 19% | 18.7% | Same |
| Years to Recover | 13 years | 9 years (so far) | N/A |
| Real Price Falls* | 37.4% | 26% | Lower than 1990s |
| Years to Recover | 9 years | 7 years | Less than 1990s |
*Inflation adjusted
Is our property market stronger or weaker than in the past?
On first glance of these figures, it suggests that the property market is stronger now that it was during the last recession. And to some extent this is true.
There have been less than half the number of repossessions than in the last recession and, of course, fewer ended up in financial difficulties as mortgage rates were reduced to their historic low of 0.5% – and are still running at that rate. In the last recession, rates were hitting 15%.
However, what this doesn’t show is that the ‘growth’ we saw since the 1990s recession isn’t coming through anywhere near at the same high rate as it did before, even though we have, in theory, a stronger market.
For example, in the years 2000 and 2003, property prices in London boroughs grew between 24% and 35% year on year. This time around, the growth we have seen in London – good though it’s been – was only beaten in Kensington and Chelsea and Westminster. No other borough managed as good a recovery.
Looking at how growth is rippling out to other areas, we are also seeing an even bigger difference in growth. Areas such as Reading grew at over 30% year on year in June 2000. But this time around, average house price growth year on year is only half this rate at 16%; still good but a lot lower.
When we look at areas further down the M4 to see if price growth continues to ripple out into the wider UK market, it’s difficult to see this trend – so far – which is why 2016 will help us to understand whether this ripple effect will continue, or if price rises are being curbed. Currently in Swindon, property prices have hit just an 8.6% rise year on year, whereas after the last recession, prices rose in June 2000 by 27.9%; three times more growth than we’ve seen so far.
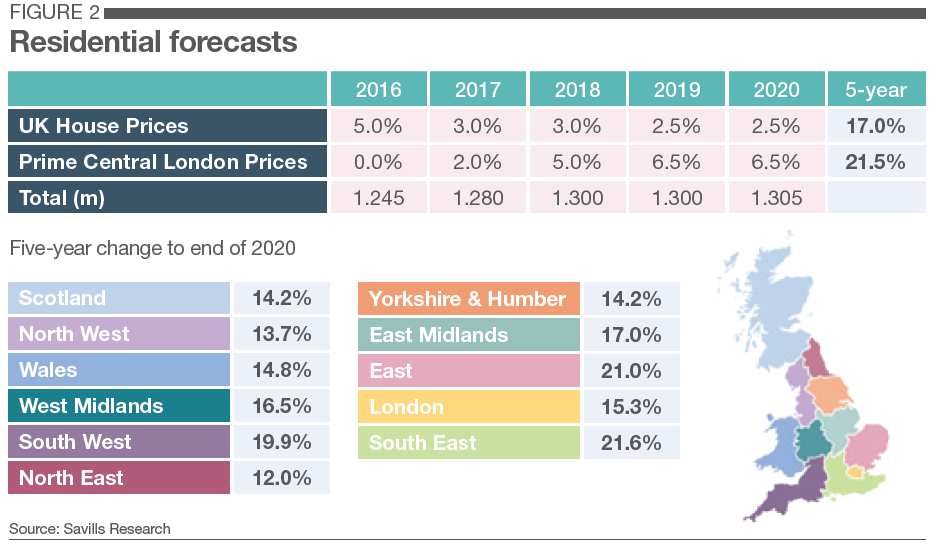
Looking forward, Savills seem to confirm that we are in for lower house price growth – and lower property sales, too. They forecast that property price growth will be limited to “house price growth dependent on earnings and the pace of economic growth both at a national and regional level”. What this means – and the figures suggest to date - is that due to the diverse economic and earnings performance of different areas, one new phenomenon we are likely to continue to see following the credit crunch are hugely differing performances from one area to another. Strong economies will do well, while those which are stagnant are likely to see property prices stay pretty flat.
To find out what’s happening to property prices in towns and cities across the UK, read our latest house price report.
For forecasts, see the latest Savills report.
What’s happening to property prices and rents in your area? With property performance being so diverse, it would be really interesting to know what you are seeing locally, so do get in touch.
For FREE, independent and up-to-date advice on buying, selling and renting a home, sign up for FREE at Property Checklists. Join now to access our FREE checklists, including:-
