
I came across some really interesting data from Countrywide this week – and a super map of sales and lettings in the UK!
Currently there are around 26 million homes in the UK, of which:
Around a third are social homes
Approximately 20% are rented privately
12 million are owned, of which over half are owned without a mortgage
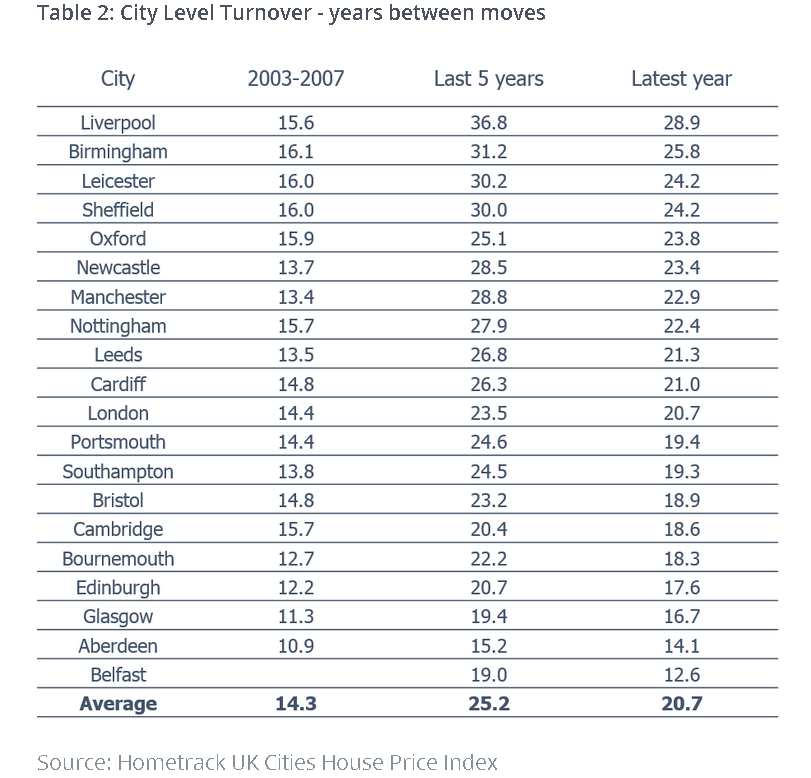
And with Hometrack’s data showing that people across the country are only moving up to once every 21 years on average (and 29 years in Liverpool), what Countrywide have found is that, based on current trends, as many properties will be sold as rented in 2017.
Looking to sell? Read our expert checklist.
According to Countrywide:
“The last downturn saw the number of people renting privately increase by 50% inside five years, growth which could well be repeated.
“In 2015 there were c.1.6m homes listed for sale and c1.3 million listed for rent. While cities account for around 80% of rental listings, this figure has fallen as the number of homes to rent in more rural markets has grown.
“While the number of homes on the rental market has continued to rise steadily over 2016, 2017 could be the first year when more homes are put up for rent than for sale.”
What does this actually mean?
Probably the most interesting thing from the report is how much of the lettings stock is cities based, which the map below shows best:
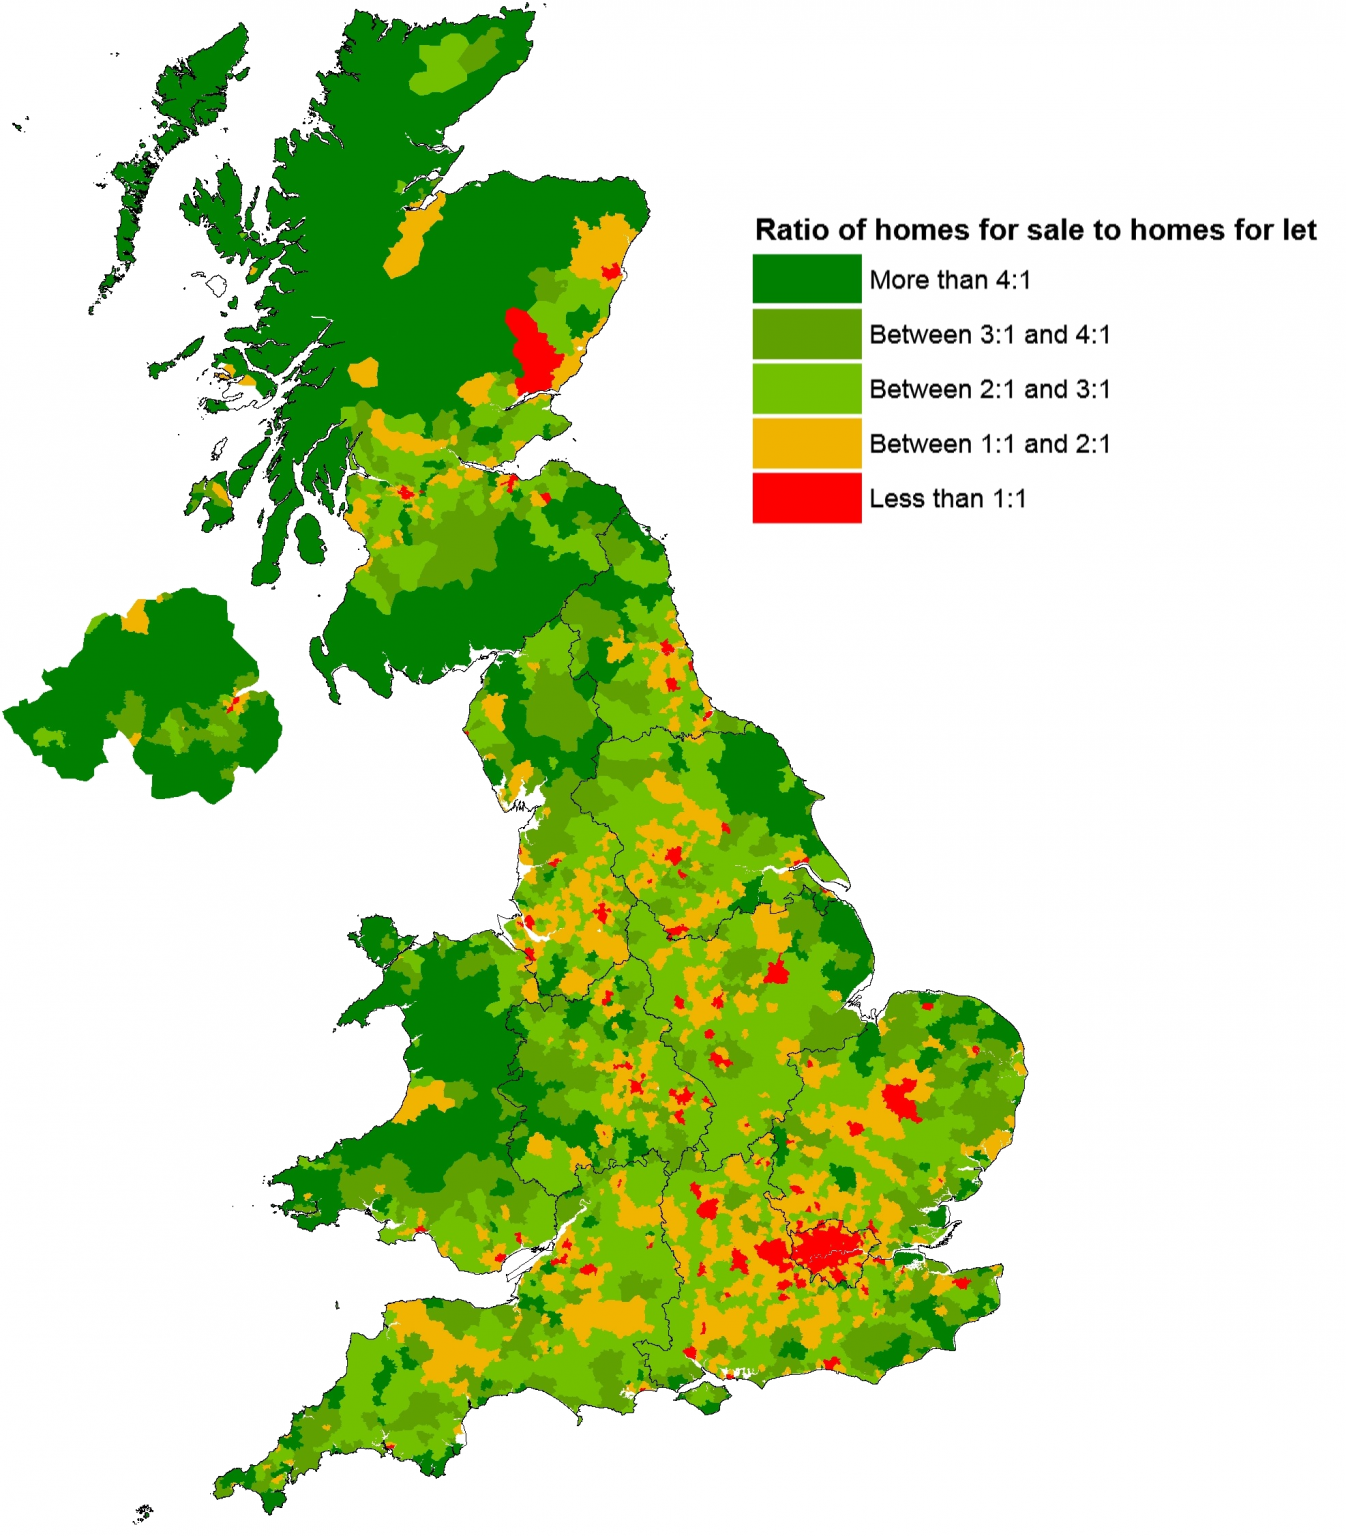
Source: Countrywide
What investors in particular need to be aware from looking at this map is that investing outside of the South needs to be done carefully due to the huge differences in the lettings/sales market from the Midlands upwards as well as the huge difference in capital growth opportunities.
Yes it may be possible to buy properties cheaper than ‘down south’ and get some good rental income returns in comparison, but the issue is that the rental markets are quite specifically located and the capital growth has been nowhere near as good as that seen in the South and London. And with increased taxes on the horizon, careful analysis is required to ensure deals stack up for the long term.
Looking to let? Remember to join a landlord association.
In addition the LSL Acadata HPI heat map clearly shows the lack of growth from the Midlands upwards and, with house price appearing to slow across the country – even in London – these areas may miss out on the ‘boom’ we’ve seen in the South since the recovery from the credit crunch.
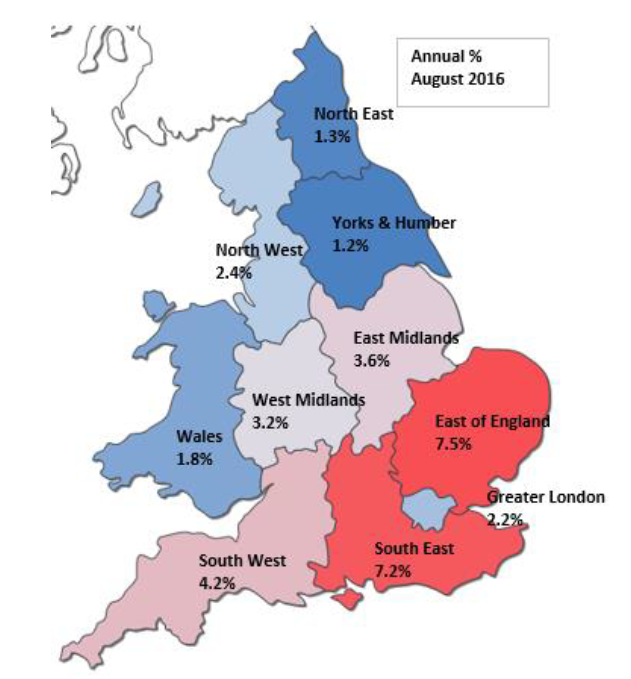
Heat map of the annual change in the average house price, analysed by region, August 2016.
Future property price forecasts on the horizon
According to Countrywide, property prices are expected to fall in 2017, and are predicted to recover in 2018.
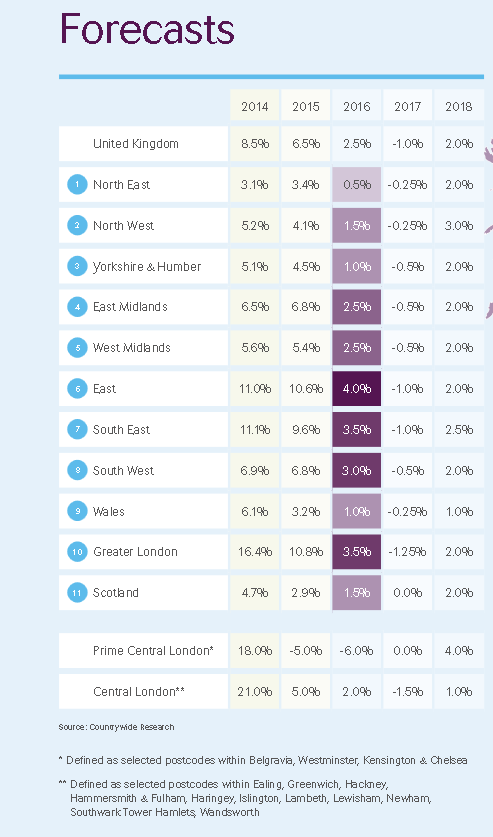
Source: Countrywide
However, another view is offered by Knight Frank who, unlike Countrywide, predict in this chart that house price growth in 2017 will be similar to 2016:
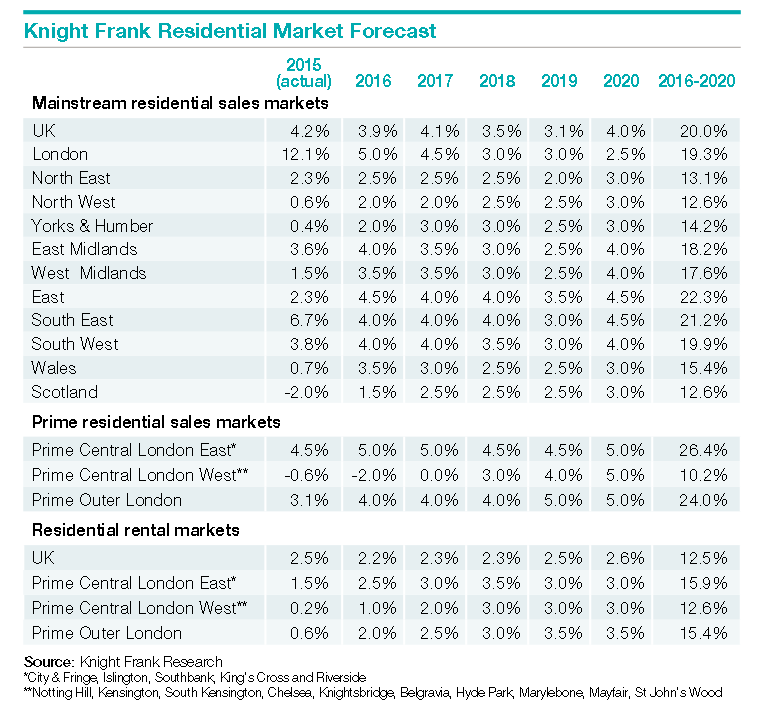
Source: Knight Frank
They do, however, issue a note of warning: “But just because the worst of the original Brexit predictions for the economy haven’t transpired it doesn’t mean the property market is guaranteed a smooth ride.”
What’s your take on the outlook for property prices – and what’s happening in your area? Do let me know, contact me here.
