
Don’t get too excited: this ‘average figure’, based on data from the Halifax, is one of the classic ones that makes people believe every house has increased by this much – and it absolutely hasn’t! What the stats actually show you is that half the housing stock has lost value, in real terms, when you take into account inflation, ie the cost of living.
Property stock in the North East has increased over the last 10 years by half this much: just 26%. That means that each year, property prices in this area have actually increased by only 2.25% per year. This is lower than inflation, so for anyone owning property outright which performs at this level, if they cashed it in, the property would be worth less than they paid for it.
In fact, for a property to retain its real value over the last 10 years, it would need to have increased in value by just over 33%.
When looking at the Halifax research, it indicates that the value of our private housing stock was £5.1 trillion by August of last year. This is up £1.8 trillion from 2005; a rise which is the equivalent of just over £75,000 per household in the owner-occupied and private rental sectors.
But in actual fact, the chart below shows that only six of the 12 regions (ie half) have seen property prices grow, on average, in excess of inflation, ie more than 33%.
That means that this enormous increase is focused purely on London which has seen over 100% growth in value, followed by Scotland which has increased by 72% and the East of England and the South East by 54% and 55% respectively.
The South West, Yorkshire and the Humber grew in line with inflation.
Value of Privately Owned Housing Stock in the UK 2005-2015
|
Region |
Year End 2005- £ billion |
Year End 2014 - £ billion |
2015* - £ billion |
Total % change over the decade |
|
North East |
96 |
116 |
121 |
26% |
|
North West |
305 |
375 |
394 |
29% |
|
Yorkshire and the Humber |
218 |
282 |
295 |
35% |
|
East Midlands |
213 |
262 |
277 |
30% |
|
West Midlands |
258 |
321 |
336 |
30% |
|
East |
354 |
509 |
546 |
54% |
|
London |
552 |
1,080 |
1,132 |
105% |
|
South East |
612 |
891 |
949 |
55% |
|
South West |
339 |
437 |
460 |
36% |
|
Scotland |
189 |
313 |
325 |
72% |
|
Wales |
136 |
168 |
174 |
28% |
|
Northern Ireland |
64 |
75 |
83 |
29% |
|
UK |
3,336 |
4,829 |
5,091 |
53.00% |
Overall though, housing equity is in reasonable health
The next analysis Halifax did was to find out how much, by region, people had borrowed to buy a home versus the amount of equity they have in a property. Because mortgage debt value has grown over this period of time, from just above £94 billion a decade ago to £128 billion as of August 2015, in contrast, the value of the private housing stock has increased by more than five times as much as this.
Value of Privately Owned Housing Equity by Region - 2015
|
Region |
Value of Housing Stock 2015* - £ billion |
Value of Residential Mortgage Loans Outstanding 2015** - £ billion |
Net Housing Equity 2015 - £ billion |
Net Housing Equity per household - |
|
North East |
121 |
35 |
86 |
94,419 |
|
North West |
394 |
111 |
283 |
109,043 |
|
Yorkshire and the Humber |
295 |
79 |
216 |
112,279 |
|
East Midlands |
277 |
61 |
216 |
127,465 |
|
West Midlands |
336 |
84 |
251 |
128,703 |
|
East |
546 |
84 |
462 |
212,263 |
|
London |
1,132 |
333 |
798 |
305,749 |
|
South East |
949 |
227 |
722 |
223,197 |
|
South West |
460 |
109 |
351 |
164,767 |
|
Scotland |
325 |
84 |
241 |
124,679 |
|
Wales |
174 |
39 |
135 |
114,569 |
|
Northern Ireland |
83 |
29 |
53 |
82,468 |
|
UK |
5,091 |
1,276 |
3,815 |
165,947 |
Find out whether your property value has grown more than ‘the average’
One way to check how your property is performing (whether it is one you live in or own as an investment) is to look up sold property prices from sites such as www.nethouseprices.com.
All you need to do is put in your property’s postcode and, if properties on your street, in the North East, for example, have grown by more than 26% over the last 10 years, then you know it has outperformed. If it’s less, then your property has underperformed. Here are some examples of over and under performers in London, compared with the North East:
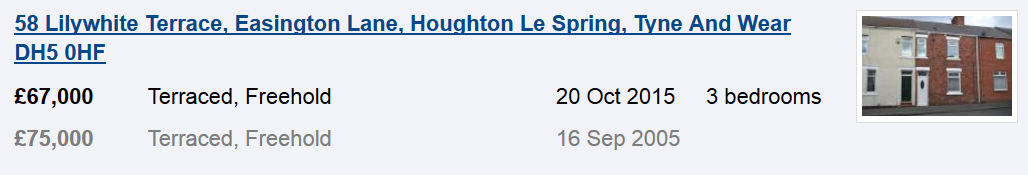
North East property which has under-performed since 2005 versus Halifax’s figures:-
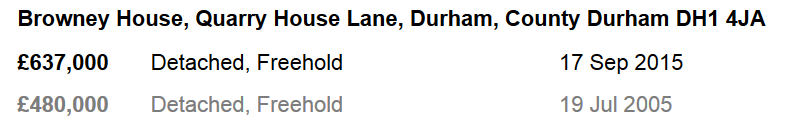
North East property which has over performed versus 2005 according to Halifax’s data:
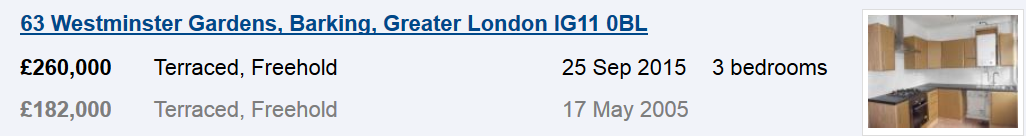
London property which has under-performed:-
London property which has over performed:-

For FREE, independent and up-to-date advice on buying, selling and renting a home, sign up for FREE at Property Checklists. Join now to access our FREE checklists, including:-
