
UK, England and Wales data
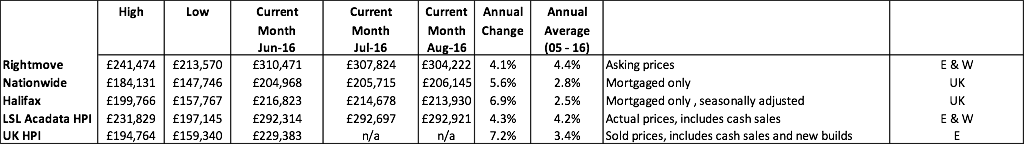
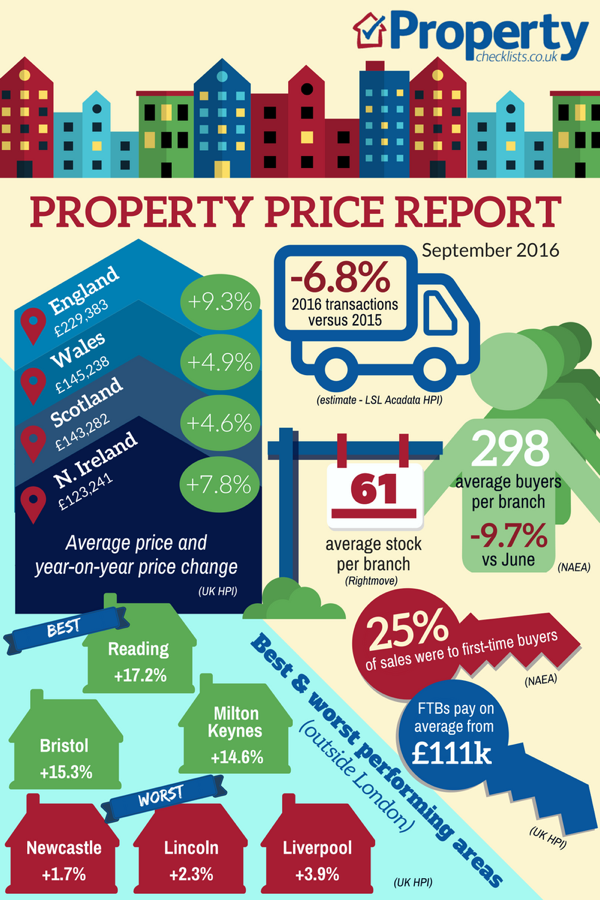
The LSL Acadata HPI is probably the most interesting read this month. One of the key things is that average property prices, according to their indices, were £291,103 in January, rose to £297,205 in February but from May have hardly moved and hovered around the £292,000 level. And having started the year 6% up, house price inflation is now down to 4.3% - although that’s not bad considering the Brexit vote! The RICS calm the market’s nerves over the vote, saying “House price inflation regains some momentum”; “Sales hold steady over the month” and “Buyer enquiries and sales instructions continue to slip, albeit at a greatly reduced pace”. So all in all, considering we’ve had a pretty big shock to our system and to some extent evidence of the economy slowing, the impact on the property market of the Brexit vote so far seems pretty minimal. At the end of the day, life goes on and people need a roof over their heads!
For more, download my comprehensive property price report.
What's happening in the UK regions?
Source: UK HPI
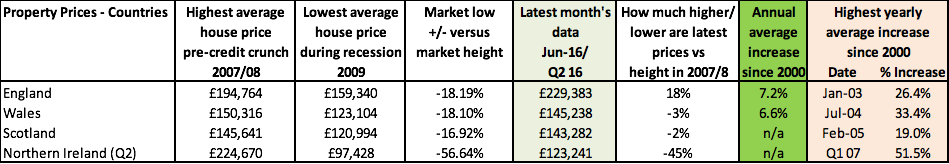
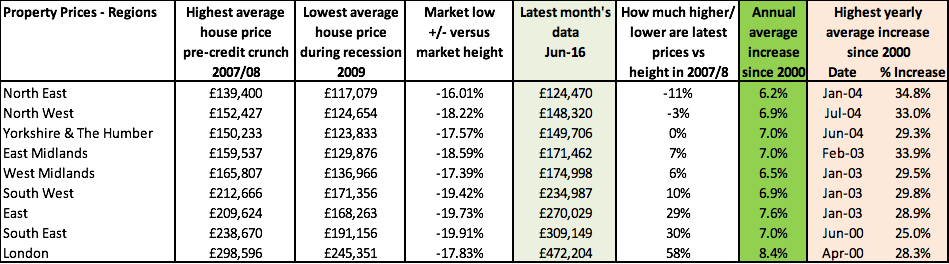
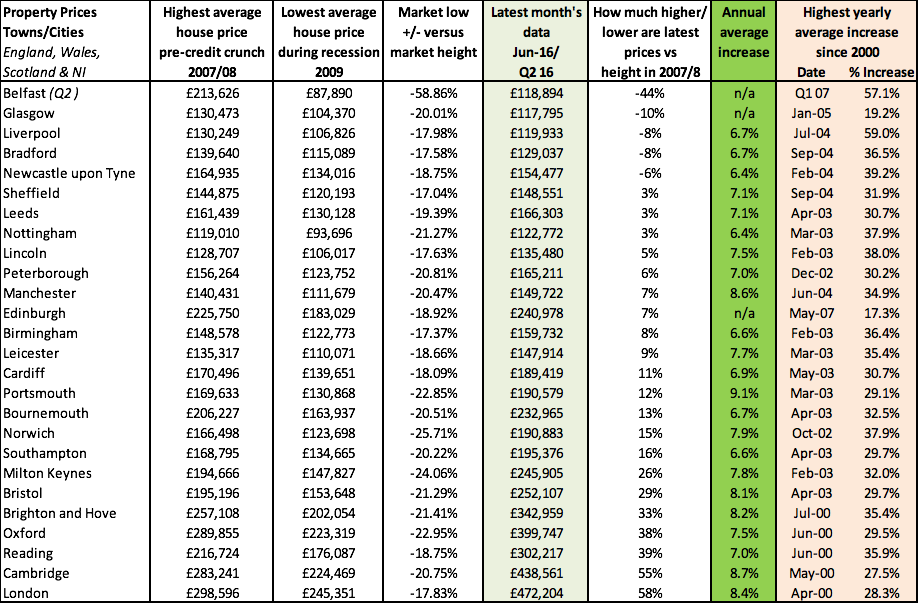
Halifax’s data for Quarter two this year concentrates on the phenomenal differences from one region to the other, especially since the credit crunch. The regional picture from all the indices just shows how dangerous communicating ‘averages’ are now to the public. Telling people prices are up by 4-5% year on year, when for some, such as in the North, Wales and especially Northern Ireland, property prices are still substantially down versus what they were worth pre-credit crunch is not helpful. The key task for agents now before attending instructions is to make sure they know what someone paid for a property. Looking at property price reports helps us understand what a buyer and seller might think is happening in the market place, but it’s sold property price data that will tell us about their ‘individual property market’ performance which, if people bought around 2005-2007 could mean their property is still worth less than they paid for it, nearly a decade on. I highlighted this in the report done with the BBC on Peterborough which showed some property prices were up, some down and some had stayed the same in the last 10 years. This is the kind of analysis every agent should be doing – and advising local people of – on their area. It’s time for agents to be the ones that inform and educate on local property markets.
Looking to move up the ladder? Read our trading up checklist.
What's happening in your town and city?
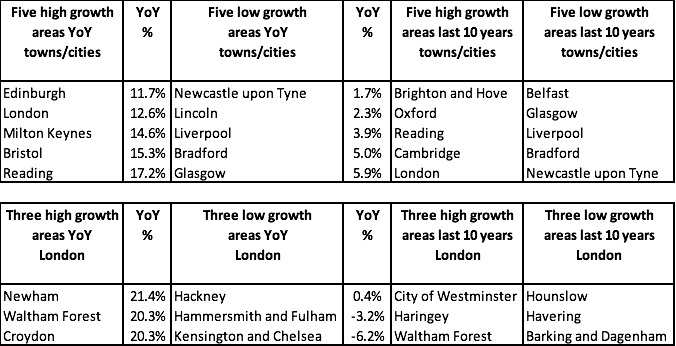
Source: UK HPI
Buying for the first time? Read our expert checklist
Double digit growth is now starting to reach areas outside of London and the LSL Acadata HPI shows that it’s not just strong economic towns such as Milton Keynes and Bristol that are doing well, but highlights that more affordable areas around London such as Luton, Slough and Thurrock are all doing well, seeing growth of 14-16%. Meanwhile, savvy buyers in the prime markets seem to have pushed down house prices, probably through tough negotiation on the back of the Brexit vote. These falls though, coupled with the fall in sterling, may well end up causing a revival in the prime markets, unless the high taxation brought in over the last few years makes other international property hotspots more attractive.
