
Although London is often reported as ‘one market’, it really isn’t. From our analysis there are thousands of markets, just in Greater London, but we break this down for you into the 32 London Boroughs, so ‘click here’ if you just want to see how your own Borough has performed.
Summary of London property price reports
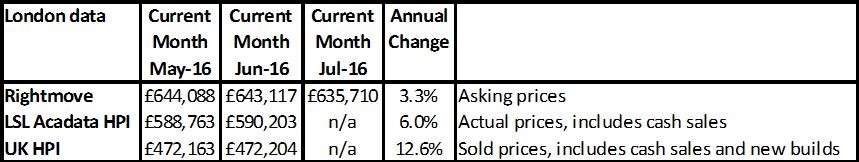
We do keep hearing that the property market in the Capital is slowing, but it’s unlikely that most ‘normal’ buyers won’t be feeling that at the moment, as it’s mostly areas like Kensington and Chelsea, Fulham and Hammersmith where prices easily end up being £1 million for a pretty normal house or flat. Overall though the Rightmove ‘lead indicator’ shows that inflation in the London housing market has dropped back, while the UK HIP data which tends to be three or more months out of date (but accurate) is still showing signs of strong growth. Finally, it’s worth noting that the UK HPI data shows an average of £472,000 for a London property as opposed to the huge average shown by Rightmove which is for all properties, including those on sale for tens of millions of pounds!
Want to find out what's happening in your borough? Click here
Source: UK HPI
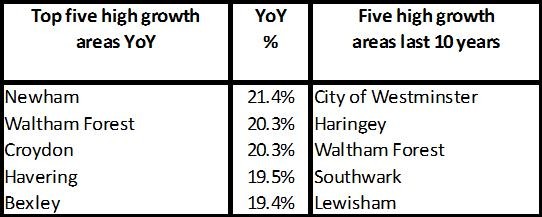
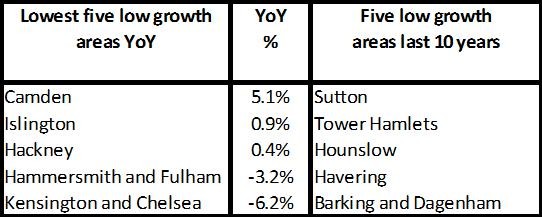
If we were filling in this table a few years ago the best risers would have been the likes of Haringey, Camden and Hammersmith. However, we’ve seen a real ‘ripple’ effect on property prices in the London Boroughs as the central regions started to rise first, some only falling for just nine months before rising rapidly again and now we are seeing the Boroughs on the very outskirts of Greater London reaping the rewards for homeowners of double digit property price growth.
Want to find out what's happening in your borough? Click here
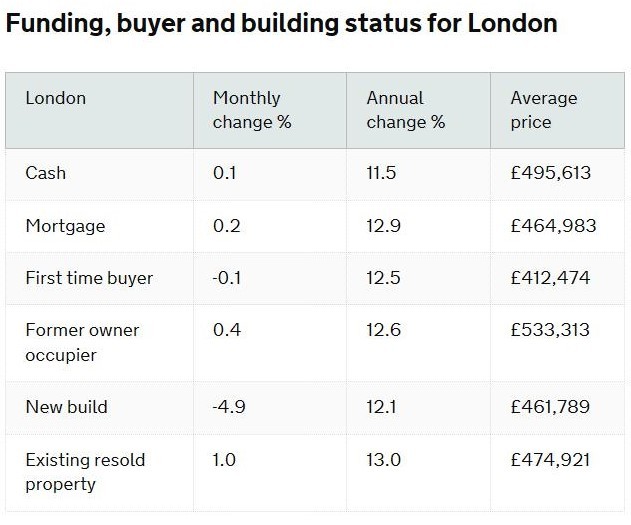
Does price inflation differ depending on who’s buying?
What’s important to bear in mind with regards to London though is the great differences in property prices via each London Borough but also between first time buyers versus someone that already owns a home. In the stats below, it shows that FTBs spend (on average) £412,500 on a property (so some more/some less) while for those who own already, because of their increased wealth through property price growth and a strong market due to the shortage of properties versus demand, they can afford to pay on average £533,313 - that’s 30% more than FTBs.
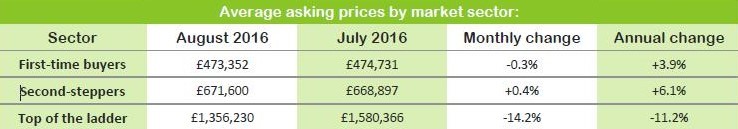
Although the stats below show for the HPI index (which measures past price growth), the Rightmove stats show that annually, prices are down quite substantially at the top end of the market while price growth trends for FTBs and Second Steppers seems to be reducing too.
Buying for the first time? Read our FTB quick guide
Source: UK HPI
Source: Rightmove HPI
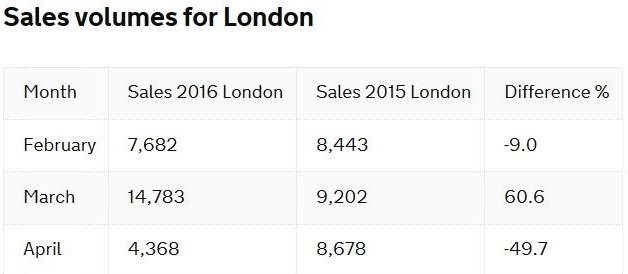
The number of properties sold in London are sliding post the Brexit Vote and Stamp Duty increase
Source: UK HPI
The map from LSL Acadata HPI below shows that all areas are looking at selling less in Q2 versus Q3, but with the stamp duty change and the Brexit vote on top, it’ll be October/November time before we can see some real trends.
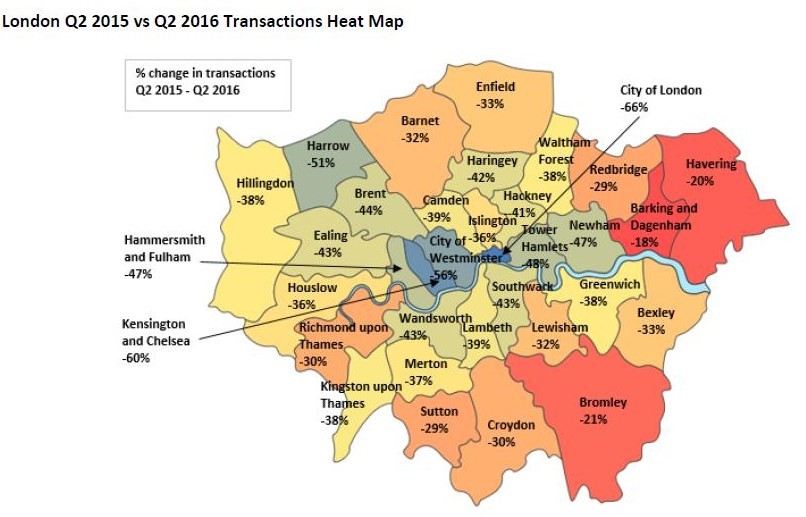
Source: LSL Acadata HPI
Finally, time to sell wise, according to Rightmove, the fall in sales and in demand and steadying of house prices means the average time to sell is around six weeks - pretty much a ‘norm’ for the market.
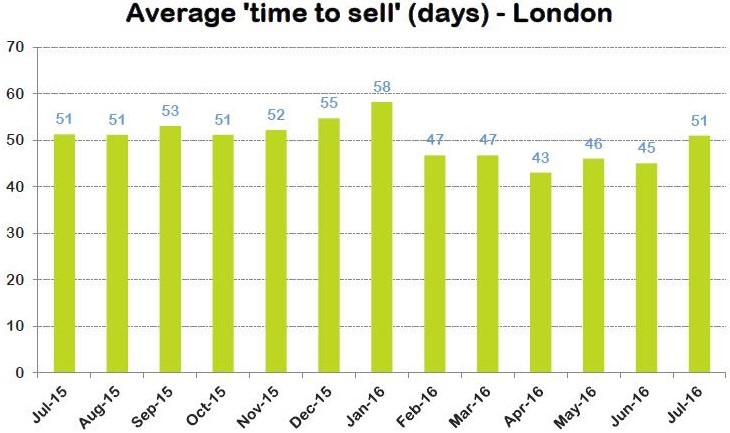
Source: Rightmove HPI
Looking to sell sharpish? Read how to sell your home quickly
Want more? Download my comprehensive report here.
